Senior Physical Therapist Salary in Apple Valley, CA: $163,845 (2026)
Quick Answer:The top tier of physical therapists working in Apple Valley, CA — those at or above the 90th percentile — pull in $163,845/year or more for 2026, based on BLS OEWS 2025 estimates for SOC 29-1123. Strip back Apple Valley's price premium (BEA RPP 113.1, 13% above national) and that top-decile pay carries the same buying power as $144,867 in average-cost America. The 28% spread above city median typically rewards 7+ years of practice or specialty credentials.
Based on BLS state-level estimates · View source
With a projected median annual salary of $127,734 in 2026, experienced physical therapists in Apple Valley, CA, have significant earning potential, particularly at the senior level. Top earners in this category can expect to reach salaries as high as $163,845, highlighting the considerable experience premium gained through years of dedicated practice. The gap between the median and top-tier pay suggests that to achieve that level of compensation, professionals must not only accumulate experience but also potentially pursue advanced specializations and certifications like the Orthopedic Clinical Specialist (OCS) or Sports Clinical Specialist (SCS). This trajectory indicates that those aiming to excel in their careers must be proactive in both their skill development and networking within the healthcare community.
About the Apple Valley Market
Salary estimated from California average ($109,000) adjusted for local cost of living.
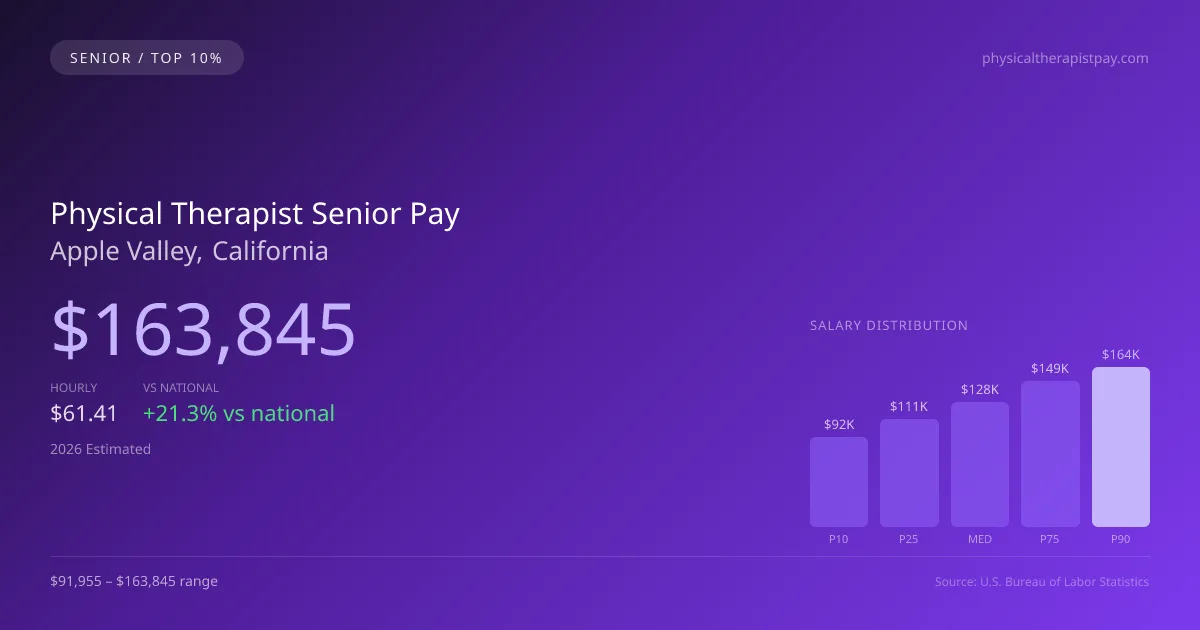
2026 Salary Percentile Distribution in Apple Valley
Experienced physical therapists at the top of the pay scale in Apple Valley earn between $149,079 and $163,845 per year (2026 est.). This $71,890 range from 10th to 90th percentile reflects significant earnings potential growth over a career. The Apple Valley median of $127,734 sits 21.32% above the US median.
Top PT Salary Comparison
| Level | Apple Valley | National |
|---|---|---|
| Median (P50) | $127,734 | $105,288 |
| 75th Percentile | $149,079 | $124,141 |
| 90th Percentile (Top 10%) | $163,845 | $138,464 |
In Apple Valley, experienced physical therapists (P90) earn 28.27% more than the local median — reflecting the significant value of specialization and tenure in this market.
What Drives Top Physical Therapist Pay in Apple Valley
Advanced Certifications in California
CA physical therapists with additional specialty certifications within the physical therapy field earn significantly above the $127,734 median. Expanded-scope credentials are increasingly valued by Apple Valley employers.
Specialty Focus
Physical Therapists focusing on high-acuity or specialty areas within the physical therapy field in Apple Valley command premium compensation, often reaching the $149,079–$163,845 range.
Large Health-System & Multi-Site Experience
Large hospital systems and multi-site employers in the Apple Valley metro area often pay above-market rates for experienced physical therapists who demonstrate efficiency and leadership.
Employer Loyalty & Patient Relationships
Long-tenured physical therapists in Apple Valley with established relationships have strong negotiating leverage. In this developing market, retention bonuses and annual raises are common for top performers.
Continuing Education & Leadership
Physical Therapists in California who pursue advanced degrees, mentor junior staff, or lead clinical education programs position themselves for the highest compensation tiers and management roles.
Physical Therapist Career & Wage Growth Path in Apple Valley
Clinical Physical Therapist
0-5 yearsSenior/Lead Physical Therapist
5-10 yearsPhysical Therapist Department Manager
10+ yearsEducator / Specialty Leadership
AdvancedApple Valley ranks #123 of 158 California cities for top earner physical therapist salary (90th percentile: $163,845).
Top 10% physical therapist compensation in Apple Valley ($163,845) is 2.55% below the California average P90 ($168,139).
2019 BLS Actual
$147,605
2025 BLS Actual
$159,911
2026 Current Est.
$163,845
2019–2027 Growth
+13.7%
Salary Trajectory for Physical Therapists in Apple Valley (2019–2027)
2019–2025: actual BLS OEWS data for this metro area. 2026+: CAGR 2.46% projection.
| Year | Annual Salary | Status |
|---|---|---|
| 2019 | $147,605 | Actual |
| 2020 | $150,019 | Actual |
| 2021 | $150,409 | Actual |
| 2022 | $152,444 | Actual |
| 2023 | $154,858 | Actual |
| 2024 | $156,668 | Actual |
| 2025 | $159,911 | Actual |
| 2026(current) | $163,845 | Estimated |
| 2027 | $167,875 | Projected |
Top-earning physical therapists (90th percentile) in Apple Valley saw their compensation grow 8.3% from $147,605 in 2019 to $159,911 in 2025, based on 7 years of BLS OEWS data for this metropolitan area. At a 2.46% annual growth rate, senior-level pay is projected to reach $167,875 by 2027, reflecting continued demand for clinical expertise and expanded-function credentials.
Note: Historical values (2019–2025) are actual BLS OEWS figures for the Apple Valley metropolitan area, sourced from annual Occupational Employment and Wage Statistics surveys. 2026–2026 figures are current estimates, and 2027 values are projections, calculated using a 2.46% CAGR derived from 7-year BLS historical data. Actual salaries may vary based on employer, experience, certifications, and local market conditions.
Maximizing Your Physical Therapist Earnings in Apple Valley
Beyond salaries, the factors influencing senior physical therapist pay in Apple Valley are diverse and complex. Compensation varies widely across employer types, with outpatient orthopedic clinics typically emphasizing productivity metrics, while settings like skilled nursing facilities or sports medicine clinics may offer different incentives. Specializations such as geriatric (GCS) or women's health often command higher rates, further boosting overall earnings. Advanced education credentials like a Doctor of Physical Therapy (DPT) can significantly enhance value in the market, especially when combined with APTA membership and board certifications. Additionally, non-salary compensation components, such as clinic ownership opportunities or performance bonuses in a cash-pay model versus traditional insurance practices, are pivotal in shaping overall compensation, catering to the evolving dynamics of job satisfaction and career advancement for seasoned professionals in this field.
More salary data for Apple Valley, CA:
Frequently Asked Questions
How much do experienced physical therapists make in Apple Valley in 2026?
What drives higher physical therapist pay in Apple Valley?
What certifications boost physical therapist salary in Apple Valley?
Can experienced physical therapists make six figures in Apple Valley?
How much does physical therapist salary increase over time in Apple Valley?
Related Pages
Compare Salaries
Career Resources
Nearby Cities in California
Written by Alex Morgan, DPT
Career Analyst
Alex Morgan has over 10 years of experience in physical therapy. They specialize in orthopedic rehabilitation. Alex works in a private practice setting.
Methodology & Data Source
Top-earner salary figures on this page are 2026 projections derived from the Bureau of Labor Statistics Occupational Employment and Wage Statistics (OEWS) survey, May 2026 release. BLS reported a 90th percentile salary of $159,911 for physical therapists in the Apple Valley metro area. A 2.46% compound annual growth rate (CAGR), calculated from 6-year national BLS wage trends, was applied to project current 2026 senior-level compensation. Individual earnings depend on certifications, specialization, practice type, and years of clinical experience.
Data Sources & Methodology
Salary data for Apple Valley is estimated from official BLS state-level occupational wage data (2025), adjusted for regional cost-of-living differences using BEA RPP (Regional Price Parities).
2026 figures are projected from 2025 BLS data using a compound annual growth rate (CAGR) of 2.46%, derived from historical BLS wage trends for physical therapists (SOC 29-1123).
Compiled and verified by Alex Morgan, DPT, a licensed physical therapist with 10+ years of clinical experience. · View source data at BLS.gov