Senior Physical Therapist Salary in East Honolulu, HI: $162,798 (2026)
Quick Answer:The top tier of physical therapists working in East Honolulu, HI — those at or above the 90th percentile — pull in $162,798/year or more for 2026, based on BLS OEWS 2025 estimates for SOC 29-1123. Strip back East Honolulu's price premium (BEA RPP 119.3, 19% above national) and that top-decile pay carries the same buying power as $136,461 in average-cost America. The 32% spread above city median typically rewards 7+ years of practice or specialty credentials.
Based on BLS state-level estimates · View source
In East Honolulu, the projected salary landscape for senior physical therapists in 2026 reveals significant earning potential, with top-tier professionals earning as much as $162,798 annually and the 75th percentile making $139,732. This lucrative pay scale showcases a compelling experience premium, as the median annual salary in the area sits at $123,132. In fact, the compensation for proficient physical therapists in East Honolulu surpasses the national median by 16.95%, which stands at $105,288 for the same year. Achieving these top earnings requires not just advanced clinical skills but also a strategic approach to career advancement, potentially involving specialization, leadership positions, or even transitioning to specific high-demand settings within the rehabilitation field.
About the East Honolulu Market
Salary estimated from Hawaii average ($102,000) adjusted for local cost of living.
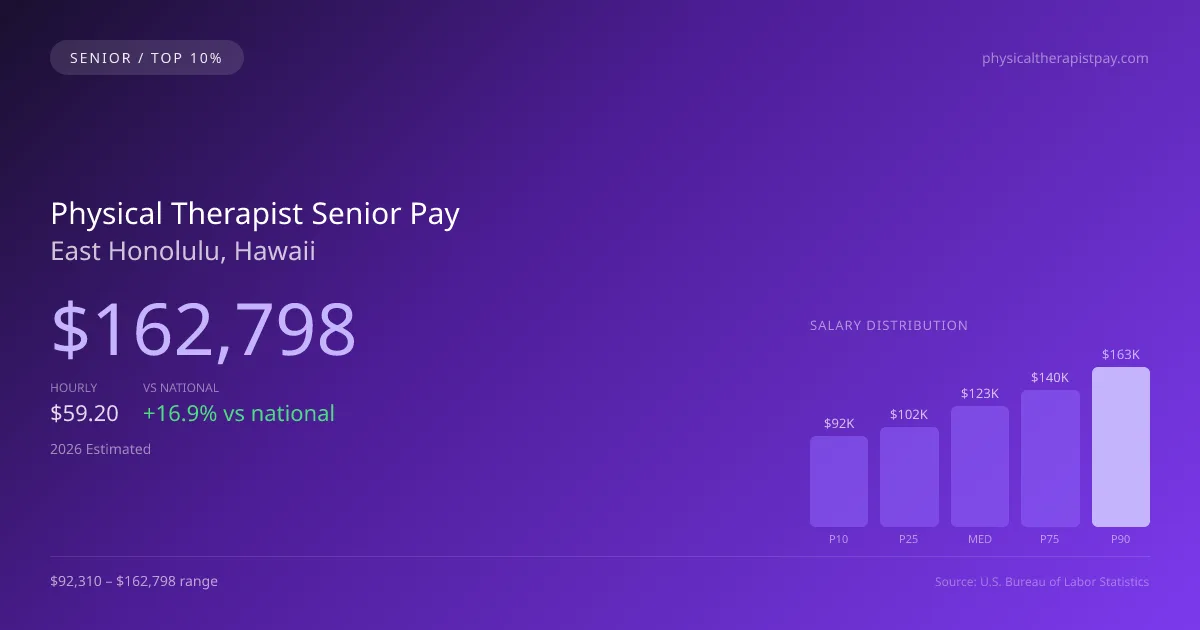
2026 Salary Percentile Distribution in East Honolulu
Experienced physical therapists at the top of the pay scale in East Honolulu earn between $139,732 and $162,798 per year (2026 est.). This $70,488 range from 10th to 90th percentile reflects significant earnings potential growth over a career. The East Honolulu median of $123,132 sits 16.95% above the US median.
Top PT Salary Comparison
| Level | East Honolulu | National |
|---|---|---|
| Median (P50) | $123,132 | $105,288 |
| 75th Percentile | $139,732 | $124,141 |
| 90th Percentile (Top 10%) | $162,798 | $138,464 |
In East Honolulu, experienced physical therapists (P90) earn 32.21% more than the local median — reflecting the significant value of specialization and tenure in this market.
What Drives Top Physical Therapist Pay in East Honolulu
Advanced Certifications in Hawaii
HI physical therapists with additional specialty certifications within the physical therapy field earn significantly above the $123,132 median. Expanded-scope credentials are increasingly valued by East Honolulu employers.
Specialty Focus
Physical Therapists focusing on high-acuity or specialty areas within the physical therapy field in East Honolulu command premium compensation, often reaching the $139,732–$162,798 range.
Large Health-System & Multi-Site Experience
Large hospital systems and multi-site employers in the East Honolulu metro area often pay above-market rates for experienced physical therapists who demonstrate efficiency and leadership.
Employer Loyalty & Patient Relationships
Long-tenured physical therapists in East Honolulu with established relationships have strong negotiating leverage. In this developing market, retention bonuses and annual raises are common for top performers.
Continuing Education & Leadership
Physical Therapists in Hawaii who pursue advanced degrees, mentor junior staff, or lead clinical education programs position themselves for the highest compensation tiers and management roles.
Physical Therapist Career & Wage Growth Path in East Honolulu
Clinical Physical Therapist
0-5 yearsSenior/Lead Physical Therapist
5-10 yearsPhysical Therapist Department Manager
10+ yearsEducator / Specialty Leadership
AdvancedEast Honolulu ranks #2 of 10 Hawaii cities for top earner physical therapist salary (90th percentile: $162,798).
Top 10% physical therapist compensation in East Honolulu ($162,798) is 22.71% above the Hawaii average P90 ($132,672).
2019 BLS Actual
$146,661
2025 BLS Actual
$158,889
2026 Current Est.
$162,798
2019–2027 Growth
+13.7%
Salary Trajectory for Physical Therapists in East Honolulu (2019–2027)
2019–2025: actual BLS OEWS data for this metro area. 2026+: CAGR 2.46% projection.
| Year | Annual Salary | Status |
|---|---|---|
| 2019 | $146,661 | Actual |
| 2020 | $149,060 | Actual |
| 2021 | $149,448 | Actual |
| 2022 | $151,470 | Actual |
| 2023 | $153,869 | Actual |
| 2024 | $157,310 | Actual |
| 2025 | $158,889 | Actual |
| 2026(current) | $162,798 | Estimated |
| 2027 | $166,802 | Projected |
Top-earning physical therapists (90th percentile) in East Honolulu saw their compensation grow 8.3% from $146,661 in 2019 to $158,889 in 2025, based on 7 years of BLS OEWS data for this metropolitan area. At a 2.46% annual growth rate, senior-level pay is projected to reach $166,802 by 2027, reflecting continued demand for clinical expertise and expanded-function credentials.
Note: Historical values (2019–2025) are actual BLS OEWS figures for the East Honolulu metropolitan area, sourced from annual Occupational Employment and Wage Statistics surveys. 2026–2026 figures are current estimates, and 2027 values are projections, calculated using a 2.46% CAGR derived from 7-year BLS historical data. Actual salaries may vary based on employer, experience, certifications, and local market conditions.
Maximizing Your Physical Therapist Earnings in East Honolulu
When exploring compensation dynamics, various specialties can considerably impact senior physical therapist pay in HI. In East Honolulu, areas like orthopedic, sports, and neurologic physical therapy tend to attract higher salaries, reflecting the demand for advanced skills in these fields. Senior professionals often find employment across a range of settings, such as outpatient clinics, hospital systems, or sports medicine facilities, with compensation differing significantly depending on the employer. Moreover, leadership roles—like clinic director or regional supervisor—offer additional financial benefits and career progression. Advanced credentials such as board certifications (OCS, SCS) further enhance earning potential and may be pursued through dynamic pathways like residencies and fellowships. Non-salary compensation factors, including productivity expectations and clinic ownership opportunities, also play a pivotal role in shaping the overall remuneration for experienced physical therapists in East Honolulu.
More salary data for East Honolulu, HI:
Frequently Asked Questions
How much do experienced physical therapists make in East Honolulu in 2026?
What drives higher physical therapist pay in East Honolulu?
What certifications boost physical therapist salary in East Honolulu?
Can experienced physical therapists make six figures in East Honolulu?
How much does physical therapist salary increase over time in East Honolulu?
Related Pages
Compare Salaries
Career Resources
Nearby Cities in Hawaii
Written by Alex Morgan, DPT
Career Analyst
Alex Morgan has over 10 years of experience in physical therapy. They specialize in orthopedic rehabilitation. Alex works in a private practice setting.
Methodology & Data Source
Top-earner salary figures on this page are 2026 projections derived from the Bureau of Labor Statistics Occupational Employment and Wage Statistics (OEWS) survey, May 2026 release. BLS reported a 90th percentile salary of $158,889 for physical therapists in the East Honolulu metro area. A 2.46% compound annual growth rate (CAGR), calculated from 6-year national BLS wage trends, was applied to project current 2026 senior-level compensation. Individual earnings depend on certifications, specialization, practice type, and years of clinical experience.
Data Sources & Methodology
Salary data for East Honolulu is estimated from official BLS state-level occupational wage data (2025), adjusted for regional cost-of-living differences using BEA RPP (Regional Price Parities).
2026 figures are projected from 2025 BLS data using a compound annual growth rate (CAGR) of 2.46%, derived from historical BLS wage trends for physical therapists (SOC 29-1123).
Compiled and verified by Alex Morgan, DPT, a licensed physical therapist with 10+ years of clinical experience. · View source data at BLS.gov