Senior Physical Therapist Salary in Norfolk, NE: $111,608 (2026)
Quick Answer:The top tier of physical therapists working in Norfolk, NE — those at or above the 90th percentile — pull in $111,608/year or more for 2026, based on BLS OEWS 2025 estimates for SOC 29-1123. Strip back Norfolk's price premium (BEA RPP 91.5, 8% below national) and that top-decile pay carries the same buying power as $121,976 in average-cost America. The 24% spread above city median typically rewards 7+ years of practice or specialty credentials.
Based on BLS state-level estimates · View source
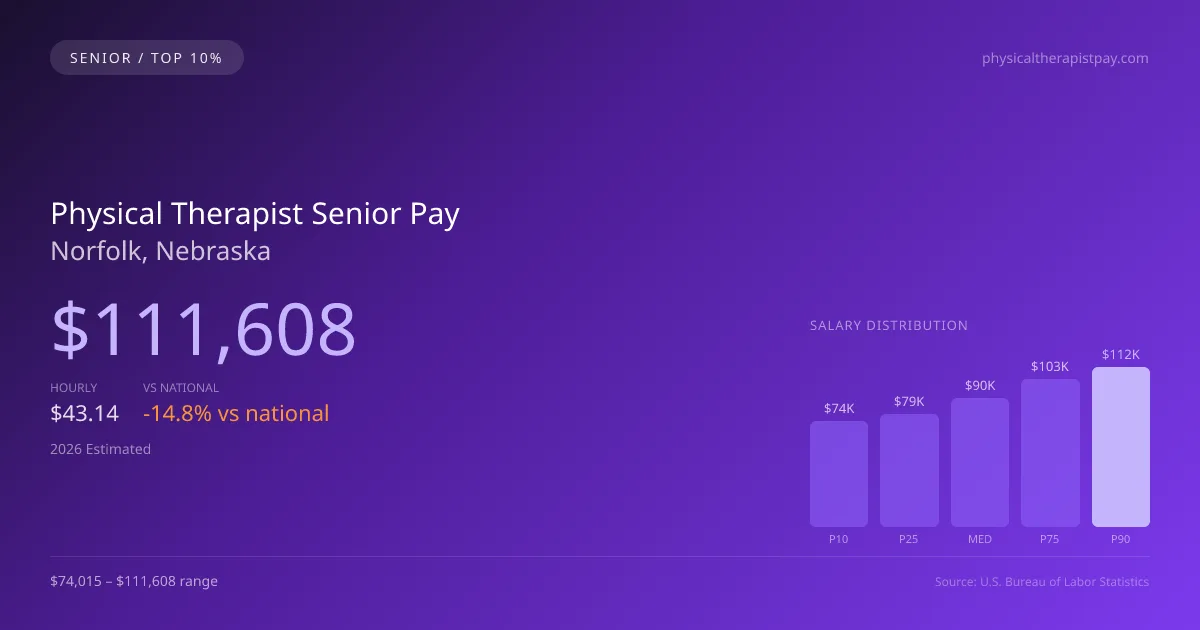
In 2026, the salary landscape for senior physical therapists in Norfolk, NE, demonstrates a compelling variance for experienced professionals. The top earners in this specialized field, ranked at the 90th percentile (P90), are projected to reach $111,608 annually, while those at the 75th percentile (P75) can expect about $103,378. This contrast is significant when positioned against the median annual salary of $89,721, underscoring the experience premium available to those who have honed their skills and expertise over more than seven years. Achieving top-tier pay in Norfolk may require pursuing advanced credentials, specializing in high-demand areas, and often taking on leadership roles within organizations. With the national median salary for physical therapists at $105,288, those in Norfolk's market find themselves approximately 14.79% lower, making strategic career choices crucial for maximizing earning potential.
About the Norfolk Market
Salary estimated from Nebraska average ($88,000) adjusted for local cost of living.
2026 Salary Percentile Distribution in Norfolk
Experienced physical therapists at the top of the pay scale in Norfolk earn between $103,378 and $111,608 per year (2026 est.). This $37,593 range from 10th to 90th percentile reflects significant earnings potential growth over a career. The Norfolk median of $89,721 sits 14.79% below the US median.
Top PT Salary Comparison
| Level | Norfolk | National |
|---|---|---|
| Median (P50) | $89,721 | $105,288 |
| 75th Percentile | $103,378 | $124,141 |
| 90th Percentile (Top 10%) | $111,608 | $138,464 |
In Norfolk, experienced physical therapists (P90) earn 24.39% more than the local median — reflecting the significant value of specialization and tenure in this market.
What Drives Top Physical Therapist Pay in Norfolk
Advanced Certifications in Nebraska
NE physical therapists with additional specialty certifications within the physical therapy field earn significantly above the $89,721 median. Expanded-scope credentials are increasingly valued by Norfolk employers.
Specialty Focus
Physical Therapists focusing on high-acuity or specialty areas within the physical therapy field in Norfolk command premium compensation, often reaching the $103,378–$111,608 range.
Large Health-System & Multi-Site Experience
Large hospital systems and multi-site employers in the Norfolk metro area often pay above-market rates for experienced physical therapists who demonstrate efficiency and leadership.
Employer Loyalty & Patient Relationships
Long-tenured physical therapists in Norfolk with established relationships have strong negotiating leverage. In this developing market, retention bonuses and annual raises are common for top performers.
Continuing Education & Leadership
Physical Therapists in Nebraska who pursue advanced degrees, mentor junior staff, or lead clinical education programs position themselves for the highest compensation tiers and management roles.
Physical Therapist Career & Wage Growth Path in Norfolk
Clinical Physical Therapist
0-5 yearsSenior/Lead Physical Therapist
5-10 yearsPhysical Therapist Department Manager
10+ yearsEducator / Specialty Leadership
AdvancedNorfolk ranks #8 of 13 Nebraska cities for top earner physical therapist salary (90th percentile: $111,608).
Top 10% physical therapist compensation in Norfolk ($111,608) is 7.3% below the Nebraska average P90 ($120,395).
2019 BLS Actual
$100,545
2025 BLS Actual
$108,928
2026 Current Est.
$111,608
2019–2027 Growth
+13.7%
Salary Trajectory for Physical Therapists in Norfolk (2019–2027)
2019–2025: actual BLS OEWS data for this metro area. 2026+: CAGR 2.46% projection.
| Year | Annual Salary | Status |
|---|---|---|
| 2019 | $100,545 | Actual |
| 2020 | $102,190 | Actual |
| 2021 | $102,456 | Actual |
| 2022 | $103,842 | Actual |
| 2023 | $105,486 | Actual |
| 2024 | $93,037 | Actual |
| 2025 | $108,928 | Actual |
| 2026(current) | $111,608 | Estimated |
| 2027 | $114,353 | Projected |
Top-earning physical therapists (90th percentile) in Norfolk saw their compensation grow 8.3% from $100,545 in 2019 to $108,928 in 2025, based on 7 years of BLS OEWS data for this metropolitan area. At a 2.46% annual growth rate, senior-level pay is projected to reach $114,353 by 2027, reflecting continued demand for clinical expertise and expanded-function credentials.
Note: Historical values (2019–2025) are actual BLS OEWS figures for the Norfolk metropolitan area, sourced from annual Occupational Employment and Wage Statistics surveys. 2026–2026 figures are current estimates, and 2027 values are projections, calculated using a 2.46% CAGR derived from 7-year BLS historical data. Actual salaries may vary based on employer, experience, certifications, and local market conditions.
Maximizing Your Physical Therapist Earnings in Norfolk
Specialization is a pivotal factor in determining compensation for senior-level physical therapists in Norfolk. Areas such as orthopedics, sports, and neurology command premium pay, particularly when coupled with board certifications like OCS and SCS. The type of employer significantly influences pay rates, with outpatient orthopedic clinics often offering lower base salaries but potential productivity bonuses. In contrast, hospital systems may provide higher stability and benefits. Leadership pathways, such as transitioning to clinic director or faculty roles in DPT programs, can elevate earning potential, as can pursuing residency or fellowship opportunities for advanced training. Beyond salary, factors such as clinic ownership equity, productivity expectations, and the growing trend towards cash-pay models also contribute to overall financial rewards. With annual growth projected at 2.46%, positioning oneself strategically in this evolving market is more crucial than ever.
More salary data for Norfolk, NE:
Frequently Asked Questions
How much do experienced physical therapists make in Norfolk in 2026?
What drives higher physical therapist pay in Norfolk?
What certifications boost physical therapist salary in Norfolk?
Can experienced physical therapists make six figures in Norfolk?
How much does physical therapist salary increase over time in Norfolk?
Related Pages
Compare Salaries
Career Resources
Nearby Cities in Nebraska
Written by Alex Morgan, DPT
Career Analyst
Alex Morgan has over 10 years of experience in physical therapy. They specialize in orthopedic rehabilitation. Alex works in a private practice setting.
Methodology & Data Source
Top-earner salary figures on this page are 2026 projections derived from the Bureau of Labor Statistics Occupational Employment and Wage Statistics (OEWS) survey, May 2026 release. BLS reported a 90th percentile salary of $108,928 for physical therapists in the Norfolk metro area. A 2.46% compound annual growth rate (CAGR), calculated from 6-year national BLS wage trends, was applied to project current 2026 senior-level compensation. Individual earnings depend on certifications, specialization, practice type, and years of clinical experience.
Data Sources & Methodology
Salary data for Norfolk is estimated from official BLS state-level occupational wage data (2025), adjusted for regional cost-of-living differences using BEA RPP (Regional Price Parities).
2026 figures are projected from 2025 BLS data using a compound annual growth rate (CAGR) of 2.46%, derived from historical BLS wage trends for physical therapists (SOC 29-1123).
Compiled and verified by Alex Morgan, DPT, a licensed physical therapist with 10+ years of clinical experience. · View source data at BLS.gov