Senior Physical Therapist Salary in Brentwood, TN: $124,358 (2026)
Quick Answer:The top tier of physical therapists working in Brentwood, TN — those at or above the 90th percentile — pull in $124,358/year or more for 2026, based on BLS OEWS 2025 estimates for SOC 29-1123. Strip back Brentwood's price premium (BEA RPP 91.8, 8% below national) and that top-decile pay carries the same buying power as $135,466 in average-cost America. The 29% spread above city median typically rewards 7+ years of practice or specialty credentials.
Based on BLS state-level estimates · View source
For seasoned physical therapists in Brentwood, TN, entering the senior pay tier can reveal significant financial rewards. The anticipated median annual salary in 2026 is set at $96,343, but those with advanced experience have the potential to earn between $78,011 and $124,358, with the upper percentile (P90) reflecting the financial benefits of niche specialization and leadership roles. The distinction between the median and top-tier earnings underscores the experience premium in this field; reaching the higher echelons of senior physical therapist pay in Brentwood requires not only years of practice but also advanced credentials and a proven track record of specialized care, particularly in sought-after areas such as orthopedics and sports therapy.
About the Brentwood Market
Salary estimated from Tennessee average ($92,000) adjusted for local cost of living.
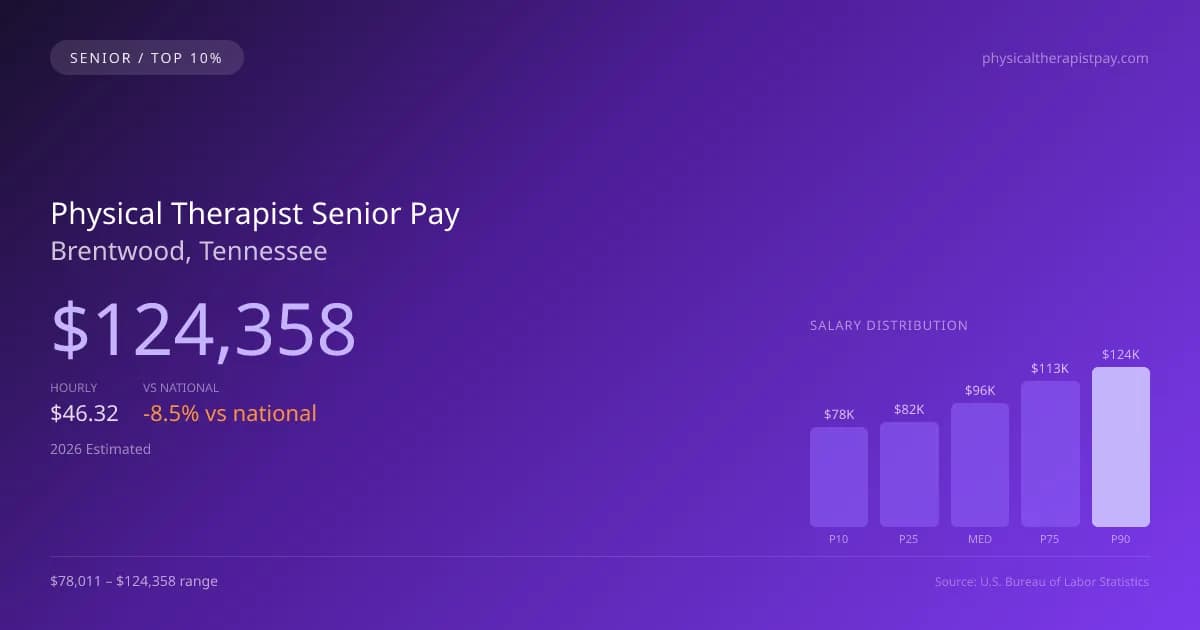
2026 Salary Percentile Distribution in Brentwood
Experienced physical therapists at the top of the pay scale in Brentwood earn between $113,184 and $124,358 per year (2026 est.). This $46,347 range from 10th to 90th percentile reflects significant earnings potential growth over a career. The Brentwood median of $96,343 sits 8.5% below the US median.
Top PT Salary Comparison
| Level | Brentwood | National |
|---|---|---|
| Median (P50) | $96,343 | $105,288 |
| 75th Percentile | $113,184 | $124,141 |
| 90th Percentile (Top 10%) | $124,358 | $138,464 |
In Brentwood, experienced physical therapists (P90) earn 29.08% more than the local median — reflecting the significant value of specialization and tenure in this market.
What Drives Top Physical Therapist Pay in Brentwood
Advanced Certifications in Tennessee
TN physical therapists with additional specialty certifications within the physical therapy field earn significantly above the $96,343 median. Expanded-scope credentials are increasingly valued by Brentwood employers.
Specialty Focus
Physical Therapists focusing on high-acuity or specialty areas within the physical therapy field in Brentwood command premium compensation, often reaching the $113,184–$124,358 range.
Large Health-System & Multi-Site Experience
Large hospital systems and multi-site employers in the Brentwood metro area often pay above-market rates for experienced physical therapists who demonstrate efficiency and leadership.
Employer Loyalty & Patient Relationships
Long-tenured physical therapists in Brentwood with established relationships have strong negotiating leverage. In this developing market, retention bonuses and annual raises are common for top performers.
Continuing Education & Leadership
Physical Therapists in Tennessee who pursue advanced degrees, mentor junior staff, or lead clinical education programs position themselves for the highest compensation tiers and management roles.
Physical Therapist Career & Wage Growth Path in Brentwood
Clinical Physical Therapist
0-5 yearsSenior/Lead Physical Therapist
5-10 yearsPhysical Therapist Department Manager
10+ yearsEducator / Specialty Leadership
AdvancedBrentwood ranks #20 of 30 Tennessee cities for top earner physical therapist salary (90th percentile: $124,358).
Top 10% physical therapist compensation in Brentwood ($124,358) is 3.83% below the Tennessee average P90 ($129,308).
2019 BLS Actual
$112,032
2025 BLS Actual
$121,372
2026 Current Est.
$124,358
2019–2027 Growth
+13.7%
Salary Trajectory for Physical Therapists in Brentwood (2019–2027)
2019–2025: actual BLS OEWS data for this metro area. 2026+: CAGR 2.46% projection.
| Year | Annual Salary | Status |
|---|---|---|
| 2019 | $112,032 | Actual |
| 2020 | $113,864 | Actual |
| 2021 | $114,160 | Actual |
| 2022 | $115,705 | Actual |
| 2023 | $117,537 | Actual |
| 2024 | $104,881 | Actual |
| 2025 | $121,372 | Actual |
| 2026(current) | $124,358 | Estimated |
| 2027 | $127,417 | Projected |
Top-earning physical therapists (90th percentile) in Brentwood saw their compensation grow 8.3% from $112,032 in 2019 to $121,372 in 2025, based on 7 years of BLS OEWS data for this metropolitan area. At a 2.46% annual growth rate, senior-level pay is projected to reach $127,417 by 2027, reflecting continued demand for clinical expertise and expanded-function credentials.
Note: Historical values (2019–2025) are actual BLS OEWS figures for the Brentwood metropolitan area, sourced from annual Occupational Employment and Wage Statistics surveys. 2026–2026 figures are current estimates, and 2027 values are projections, calculated using a 2.46% CAGR derived from 7-year BLS historical data. Actual salaries may vary based on employer, experience, certifications, and local market conditions.
Maximizing Your Physical Therapist Earnings in Brentwood
Certification and specialization greatly influence earning potential for senior professionals in the area. For instance, those holding advanced certifications, like Orthopedic Clinical Specialist (OCS) or Sports Clinical Specialist (SCS), can command higher salaries than their peers without such designations. The type of employer also impacts compensation; outpatient orthopedic clinics may offer less base salary compared to hospital systems, but could provide bonuses tied to productivity metrics, such as units per visit. Leadership roles, including clinic director or faculty positions within DPT programs, present additional opportunities for increased salary and career growth. Furthermore, embracing a cash-pay practice model is increasingly appealing, offering flexibility and the potential for greater revenue as traditional insurance reimbursements fluctuate.
More salary data for Brentwood, TN:
Frequently Asked Questions
How much do experienced physical therapists make in Brentwood in 2026?
What drives higher physical therapist pay in Brentwood?
What certifications boost physical therapist salary in Brentwood?
Can experienced physical therapists make six figures in Brentwood?
How much does physical therapist salary increase over time in Brentwood?
Related Pages
Compare Salaries
Career Resources
Nearby Cities in Tennessee
Written by Alex Morgan, DPT
Career Analyst
Alex Morgan has over 10 years of experience in physical therapy. They specialize in orthopedic rehabilitation. Alex works in a private practice setting.
Methodology & Data Source
Top-earner salary figures on this page are 2026 projections derived from the Bureau of Labor Statistics Occupational Employment and Wage Statistics (OEWS) survey, May 2026 release. BLS reported a 90th percentile salary of $121,372 for physical therapists in the Brentwood metro area. A 2.46% compound annual growth rate (CAGR), calculated from 6-year national BLS wage trends, was applied to project current 2026 senior-level compensation. Individual earnings depend on certifications, specialization, practice type, and years of clinical experience.
Data Sources & Methodology
Salary data for Brentwood is estimated from official BLS state-level occupational wage data (2025), adjusted for regional cost-of-living differences using BEA RPP (Regional Price Parities).
2026 figures are projected from 2025 BLS data using a compound annual growth rate (CAGR) of 2.46%, derived from historical BLS wage trends for physical therapists (SOC 29-1123).
Compiled and verified by Alex Morgan, DPT, a licensed physical therapist with 10+ years of clinical experience. · View source data at BLS.gov