Physical Therapist Hourly Pay in St. Clair Shores, MI: $49.78 (2026)
Quick Answer:Hourly pay for a physical therapist working in St. Clair Shores, MI runs $49.78 at the median for 2026 — annualizing to $103,524 at a standard 2,080-hour year. Figures projected from BLS OEWS 2025 (SOC 29-1123). Weighted against St. Clair Shores's regional price level (BEA RPP 93.2, 7% below national), each hour of work buys what $53.41 nationally would. A 24-hour part-time schedule grosses $62,119 per year.
Based on BLS state-level estimates · View source
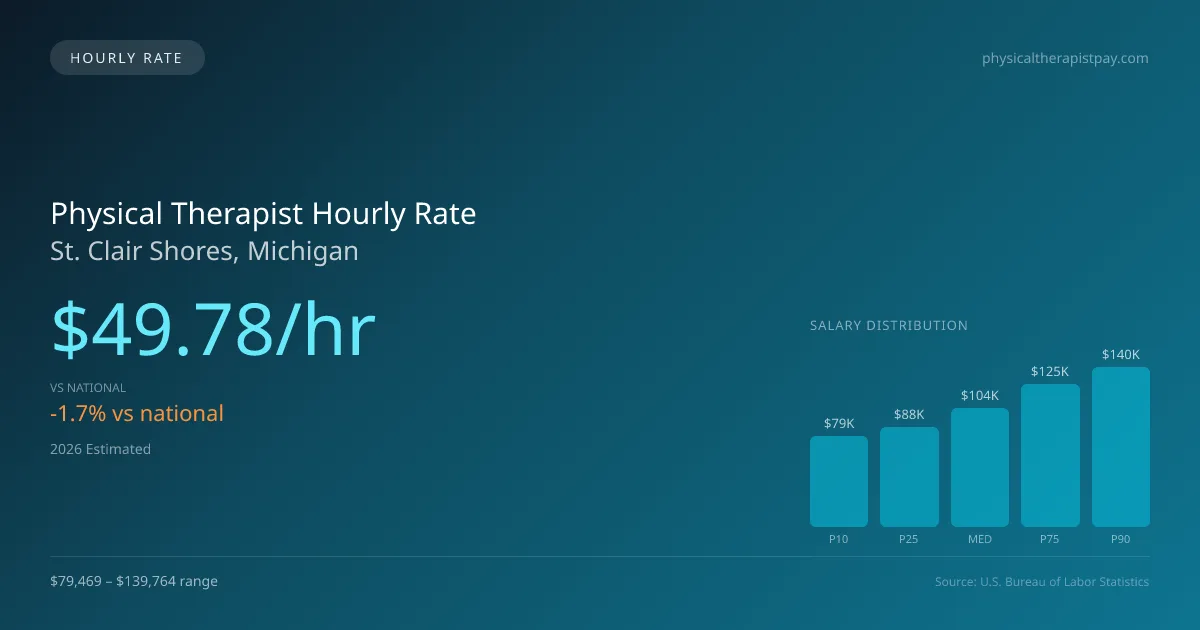
In St. Clair Shores, Michigan, the projected median physical therapist hourly pay in 2026 is $49.78, slightly below the national median of $50.62. This hourly rate is significant for both part-time and per-diem physical therapists who often find work in a variety of settings such as outpatient clinics, hospitals, skilled nursing facilities, and home health. For therapists working part-time, especially those on a 3-day workweek schedule, this rate translates into meaningful earnings, with hourly rates reflecting a wide range that spans from $38.21 for entry-level positions to $67.19 for experienced practitioners. The hourly compensation structure in this profession underscores the diverse opportunities available across St. Clair Shores while providing essential care to the community.
About the St. Clair Shores Market
Salary estimated from Michigan average ($92,000) adjusted for local cost of living.
Physical Therapist Hourly Wage Breakdown
| Percentile | Hourly Rate | Per 8hr Shift |
|---|---|---|
| Entry Level (P10) | $38.21 | $305.66 |
| Lower Range (P25) | $42.14 | $337.13 |
| Median (P50) | $49.78 | $398.20 |
| Upper Range (P75) | $59.95 | $479.59 |
| Top Earners (P90) | $67.19 | $537.55 |
Estimated Annual Income by Work Schedule in St. Clair Shores
Based on $49.78/hr median hourly rate · 2026 est.
At $49.78/hr, a physical therapist working full-time (40 hr/wk) in St. Clair Shores, MI can expect to earn approximately $103,532 per year (2026 est.). Part-time hygienists working 24 hours per week would earn around $59,730. With a cost-of-living index of 93.20 (below the national average), these earnings stretch further in St. Clair Shores.
Hourly Rate Calculator
Schedule Comparison in St. Clair Shores
| Schedule | Weekly | Monthly | Annual |
|---|---|---|---|
| Full-Time (40 hrs) | $1,991.00 | $8,628 | $103,532 |
| Part-Time (24 hrs) | $1,194.60 | $5,177 | $62,119 |
| Per Diem (16 hrs) | $796.40 | $3,451 | $41,413 |
Compare PT Wages With Similar Roles
| Role | Median Hourly |
|---|---|
| Physical Therapist (St. Clair Shores) | $49.78 |
| Physical Therapist Assistant (National Avg) | $31.26 |
| Occupational Therapist (National Avg) | $47.00 |
| Chiropractor (National Avg) | $36.85 |
| Exercise Physiologist (National Avg) | $26.75 |
Physical Therapists in St. Clair Shores, MI earn a median of $103,524 per year (2026 est.), which is 1.68% lower than the national median of $105,288 and 0.60% below the Michigan state average of $104,148.
Physical Therapist Hourly Pay vs. Cost of Living
Working 24h/week at $49.78/hr = $62,119/year (purchasing power: $66,652).
Working 40h/week (full-time) = $103,532/year (purchasing power: $111,086).
CoL index: 93.2 (100 = national average). Your dollars stretch further here.
2019 BLS Actual
$42.28/hr
2025 BLS Actual
$48.58/hr
2026 Current Est.
$49.78/hr
2019–2027 Growth
+20.6%
Hourly Rate Trajectory for Physical Therapists in St. Clair Shores (2019–2027)
2019–2025: actual BLS OEWS data for this metro area. 2026+: CAGR 2.46% projection.
| Year | Hourly Rate | Status |
|---|---|---|
| 2019 | $42.28/hr | Actual |
| 2020 | $43.03/hr | Actual |
| 2021 | $45.20/hr | Actual |
| 2022 | $46.20/hr | Actual |
| 2023 | $47.14/hr | Actual |
| 2024 | $40.98/hr | Actual |
| 2025 | $48.58/hr | Actual |
| 2026(current) | $49.78/hr | Estimated |
| 2027 | $51.00/hr | Projected |
Based on 7 years of BLS OEWS metropolitan area data, the median hourly rate for physical therapists in St. Clair Shores grew 14.9% from $42.28/hr (2019) to $48.58/hr (2025). At a 2.46% projected growth rate, hourly pay is expected to reach $51.00/hr by 2027. Part-time and per-diem physical therapists can use this multi-year trend to benchmark future contract negotiations.
Note: Historical values (2019–2025) are actual BLS OEWS figures for the St. Clair Shores metropolitan area, sourced from annual Occupational Employment and Wage Statistics surveys. 2026–2026 figures are current estimates, and 2027 values are projections, calculated using a 2.46% CAGR derived from 7-year BLS historical data. Actual salaries may vary based on employer, experience, certifications, and local market conditions.
Working as an Hourly Physical Therapist in St. Clair Shores
Physical therapists in St. Clair Shores opting for part-time work, such as a 24-hour week, can expect a take-home pay of around $57,070 annually. In stark contrast, full-time therapists working an average of 40 hours a week may earn significantly more, ranging up to $109,898. For those choosing per-diem positions, typical billing rates range from $50 to $75 per hour, and travel contracts can significantly increase earnings, with reported weekly payouts of $1,800 to $2,800. Hourly compensation can differ notably based on the type of employer; private outpatient clinics such as ATI or Athletico may offer varying pay scales compared to hospital systems, skilled nursing facilities, or pediatric settings. Physical therapists must weigh the trade-offs between lower hourly wages with benefits and higher hourly pay without health coverage. Negotiating better pay can hinge on factors like experience and additional certifications.
More salary data for St. Clair Shores, MI:
Frequently Asked Questions
What is the hourly rate for physical therapists in St. Clair Shores in 2026?
How much do part-time physical therapists make in St. Clair Shores?
Are physical therapists in St. Clair Shores paid hourly or salary?
How much does a full-time physical therapist make per year in St. Clair Shores?
Do physical therapists earn more per hour working part-time in St. Clair Shores?
Related Pages
Compare Salaries
Career Resources
Nearby Cities in Michigan
Written by Alex Morgan, DPT
Career Analyst
Alex Morgan has over 10 years of experience in physical therapy. They specialize in orthopedic rehabilitation. Alex works in a private practice setting.
Methodology & Data Source
Hourly wage figures on this page are 2026 projections based on the Bureau of Labor Statistics Occupational Employment and Wage Statistics (OEWS) survey, May 2026 release. A 2.46% compound annual growth rate (CAGR), derived from 6-year national BLS wage trends, was applied to estimate current 2026 hourly rates for physical therapists in St. Clair Shores. Part-time and full-time income estimates assume consistent weekly hours and do not account for overtime, benefits, or seasonal variation.
Data Sources & Methodology
Salary data for St. Clair Shores is estimated from official BLS state-level occupational wage data (2025), adjusted for regional cost-of-living differences using BEA RPP (Regional Price Parities).
2026 figures are projected from 2025 BLS data using a compound annual growth rate (CAGR) of 2.46%, derived from historical BLS wage trends for physical therapists (SOC 29-1123).
Compiled and verified by Alex Morgan, DPT, a licensed physical therapist with 10+ years of clinical experience. · View source data at BLS.gov