Physical Therapist Salary in Michigan: $104,121 (2026)
Quick Answer:Across Michigan's 54 metropolitan areas, the average median physical therapist pay sits at $104,121/year heading into 2026 — a figure projected from 2025 BLS OEWS wage data for SOC 29-1123. Because Michigan sits at BEA RPP 93.2 (7% below the U.S. baseline), that statewide median translates to roughly $111,718 in nationally-comparable purchasing power. Highest-paying metros: Ann Arbor ($106,980), Niles ($106,020), Clinton Township ($105,091).
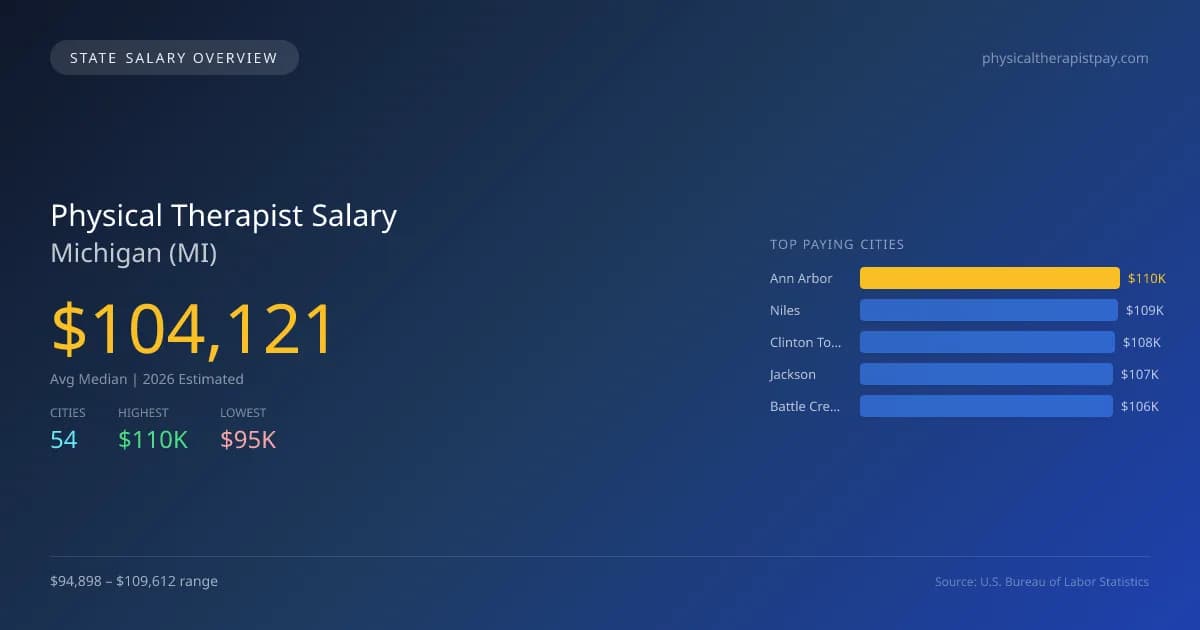
For physical therapists in Michigan, the projected average median salary in 2026 is $104,121, which is slightly lower than the national median of $105,288, reflecting a difference of -1.1%. The greatest compensation can be found in Ann Arbor, where the average salary is projected at $109,612, whereas Midland is the lowest-paying city at $94,898. This $14,714 salary gap may result from factors like cost of living, demand for healthcare services, and local competition among healthcare providers. In Michigan, physical therapists must meet specific licensing requirements and adhere to state regulations regarding the scope of practice, which can influence salary levels and job opportunities. The state's healthcare sector is growing, with a projected annual compound growth rate of 2.46%, indicating a steady demand for physical therapy professionals. With a total of 8,067 physical therapists employed across 54 metro areas in Michigan, the job market shows promise, especially in cities like Niles ($108,628), Clinton Township ($107,676), Jackson ($106,558), and Battle Creek ($106,476). As healthcare needs evolve, therapists in Michigan can expect a stable and gradually expanding job market.
Michigan Physical Therapist Salary Range
Overall salary range in Michigan: $73,405 (lowest entry-level) to $147,869 (highest top earner)
Michigan vs National Average
Michigan physical therapists earn 1.11% less than the national median ($-1,167/year difference).
Michigan Physical Therapist Salary Distribution (2026)
Physical Therapist salaries in Michigan range from $81,827 (entry-level, 10th percentile) to $127,728 (top earners, 90th percentile), with a median of $104,121. The Michigan median is $1,167 below the US national median of $105,288. The average hourly rate is $50.06/hr. Approximately 8,067 physical therapists are employed across 54 cities.
2019 BLS Actual
$90,009
2025 BLS Actual
$101,621
2026 Current Est.
$104,121
2019–2027 Growth
+18.5%
Salary Trajectory for Physical Therapists in Michigan (2019–2027)
2019–2025: actual BLS OEWS data for this metro area. 2026+: CAGR 2.46% projection.
| Year | Annual Salary | Status |
|---|---|---|
| 2019 | $90,009 | Actual |
| 2020 | $87,066 | Actual |
| 2021 | $81,992 | Actual |
| 2022 | $93,869 | Actual |
| 2023 | $99,500 | Actual |
| 2024 | $98,047 | Actual |
| 2025 | $101,621 | Actual |
| 2026(current) | $104,121 | Estimated |
| 2027 | $106,683 | Projected |
Based on 7 years of BLS OEWS data for the Michigan metropolitan area, the median physical therapist salary grew 12.9% from $90,009 (2019) to $101,621 (2025). At a 2.46% compound annual growth rate, salaries are projected to reach $106,683 by 2027 — a total increase of $16,674 (18.52%) from 2019.
Note: Historical values (2019–2025) are actual BLS OEWS figures for the Michigan metropolitan area, sourced from annual Occupational Employment and Wage Statistics surveys. 2026–2026 figures are current estimates, and 2027 values are projections, calculated using a 2.46% CAGR derived from 7-year BLS historical data. Actual salaries may vary based on employer, experience, certifications, and local market conditions.
Top 5 Highest Paying Cities in Michigan
Lowest Paying Cities in Michigan
| City | Median Salary |
|---|---|
| Midland | $94,898 |
| Bay City | $95,749 |
| Romulus | $96,306 |
| Ypsilanti | $96,863 |
| Mount Pleasant | $97,144 |
Best Value Cities for Physical Therapists in Michigan
When adjusted for local cost of living, these Michigan cities offer the most purchasing power for physical therapists.
| City | Nominal Salary | CoL Index | Adjusted Salary |
|---|---|---|---|
| Niles | $108,628 | 92.37 | $117,601 |
| Battle Creek | $106,476 | 90.541 | $117,600 |
| Saginaw | $106,312 | 90.891 | $116,966 |
| Jackson | $106,558 | 91.779 | $116,103 |
| Clinton Township | $107,676 | 93.2 | $115,532 |
Adjusted salary = nominal salary × (100 / CoL index). CoL index: 100 = national average. Lower index = lower cost of living.
Salary by Experience Level in Michigan
| Experience Level | Estimated Annual |
|---|---|
| Entry Level (0-2 years) | $81,827 |
| Mid Career (3-7 years) | $104,121 |
| Experienced (7+ years) | $127,728 |
Estimates based on BLS percentile data averaged across Michigan metro areas. Individual pay varies by employer, certifications, and specialization.
All 54 Cities in Michigan
| # | City | Median Salary |
|---|---|---|
| 1 | Ann Arbor | $109,612 |
| 2 | Niles | $108,628 |
| 3 | Clinton Township | $107,676 |
| 4 | Jackson | $106,558 |
| 5 | Battle Creek | $106,476 |
| 6 | Sterling Heights | $106,322 |
| 7 | Saginaw | $106,312 |
| 8 | Detroit | $105,503 |
| 9 | West Bloomfield | $105,248 |
| 10 | Monroe | $105,032 |
| 11 | Shelby Township | $105,008 |
| 12 | Dearborn | $104,959 |
| 13 | Troy | $104,786 |
| 14 | Warren | $104,587 |
| 15 | Westland | $104,513 |
| 16 | Farmington Hills | $104,291 |
| 17 | Traverse City | $104,140 |
| 18 | Dearborn Heights | $104,059 |
| 19 | Southfield | $103,862 |
| 20 | Macomb Township | $103,639 |
| 21 | St. Clair Shores | $103,524 |
| 22 | Rochester Hills | $103,466 |
| 23 | Taylor | $103,177 |
| 24 | Port Huron | $102,887 |
| 25 | Royal Oak | $102,864 |
| 26 | Wyoming | $102,793 |
| 27 | Lincoln Park | $102,790 |
| 28 | Livonia | $102,583 |
| 29 | Norton Shores | $102,552 |
| 30 | Canton | $101,817 |
| 31 | Novi | $101,784 |
| 32 | Lansing | $101,753 |
| 33 | Auburn Hills | $101,682 |
| 34 | Waterford | $101,627 |
| 35 | Grand Rapids | $101,538 |
| 36 | Roseville | $101,441 |
| 37 | Garden City | $101,240 |
| 38 | East Lansing | $100,894 |
| 39 | Allen Park | $100,632 |
| 40 | Pontiac | $100,562 |
| 41 | Kalamazoo | $100,329 |
| 42 | Marquette | $100,300 |
| 43 | Inkster | $100,143 |
| 44 | Muskegon | $100,114 |
| 45 | Kentwood | $99,739 |
| 46 | Holland | $99,517 |
| 47 | Ferndale | $98,828 |
| 48 | Flint | $98,321 |
| 49 | Portage | $97,821 |
| 50 | Mount Pleasant | $97,144 |
| 51 | Ypsilanti | $96,863 |
| 52 | Romulus | $96,306 |
| 53 | Bay City | $95,749 |
| 54 | Midland | $94,898 |
More Michigan Salary Data
Hourly Rates
Explore physical therapist hourly pay in Michigan cities.
Senior / Experienced
Top earner salaries for experienced physical therapists.
Compare Cities in Michigan
View all comparisons →Explore More Physical Therapist Salary Data
Frequently Asked Questions
How much do physical therapists make in Michigan in 2026?
What is the highest paying city for physical therapists in Michigan?
How does Michigan physical therapist pay compare to the national average?
What is the entry-level physical therapist salary in Michigan?
How many physical therapists are employed in Michigan?
Which Michigan city offers the best value for physical therapists?
Written by Alex Morgan, DPT
Career Analyst
Alex Morgan has over 10 years of experience in physical therapy. They specialize in orthopedic rehabilitation. Alex works in a private practice setting.
Methodology & Data Source
Statewide salary figures on this page are 2026 projections based on the Bureau of Labor Statistics Occupational Employment and Wage Statistics (OEWS) survey, May 2026 release. A 2.46% compound annual growth rate (CAGR), derived from 6-year national BLS wage trends, was applied to each metro area's reported salary to estimate current 2026 physical therapist compensation across Michigan. State averages are employment-weighted across 54 metro areas — larger metro areas with more physical therapistscontribute proportionally more to the average, producing figures that better reflect typical compensation. Individual pay varies by city, employer, certifications, and experience.
Data Sources & Methodology
Source: BLS, OEWS, 7-year dataset (–). Per-city data from annual BLS metropolitan area surveys.
2026 figures are projected from 2025 BLS data using a compound annual growth rate (CAGR) of 2.46%, derived from historical BLS wage trends for physical therapists (SOC 29-1123).
Compiled and verified by Alex Morgan, DPT, a licensed physical therapist with 10+ years of clinical experience. · View source data at BLS.gov