Physical Therapist Hourly Pay in Grand Island, NE: $42.90 (2026)
Quick Answer:Hourly pay for a physical therapist working in Grand Island, NE runs $42.90 at the median for 2026 — annualizing to $89,222 at a standard 2,080-hour year. Figures projected from BLS OEWS 2025 (SOC 29-1123). Weighted against Grand Island's regional price level (BEA RPP 86.7, 13% below national), each hour of work buys what $49.51 nationally would. A 24-hour part-time schedule grosses $53,539 per year.
Official BLS data · View source
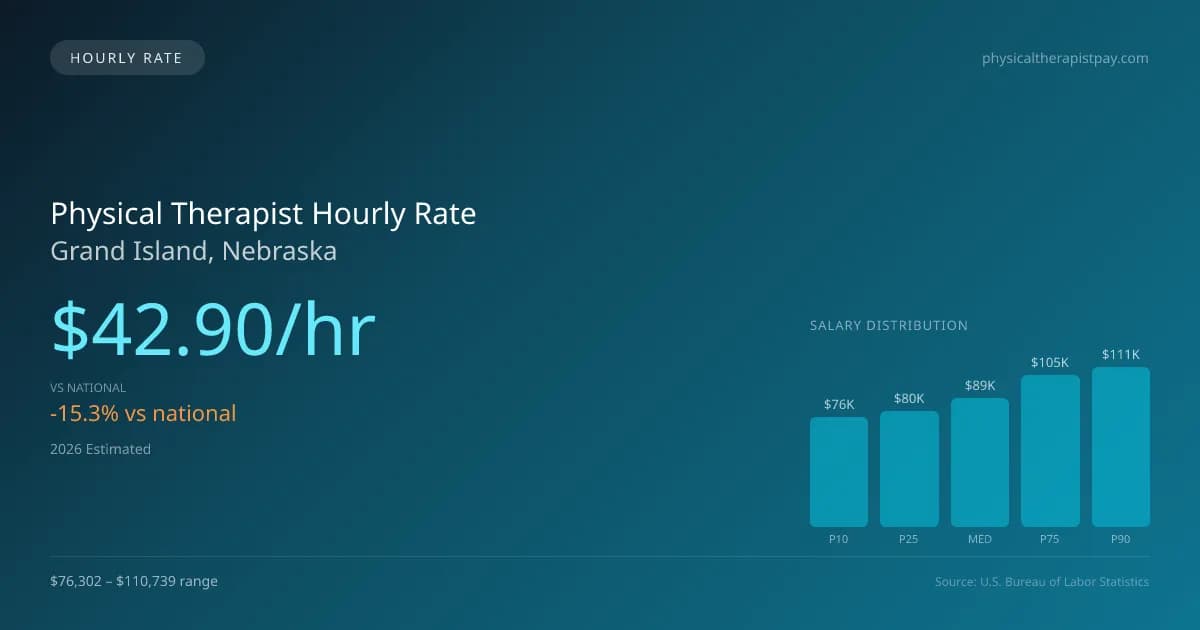
In Grand Island, Nebraska, physical therapists earn a median hourly pay of $42.90, which falls below the national median of $50.62 per hour. This rate provides insights for part-time and per-diem professionals in settings such as outpatient clinics, hospitals, and home health environments. Part-time work for three days a week can offer reasonable flexibility while still ensuring a steady income. The hourly pay range offers entry-level positions starting around $36.68, increasing to $53.24 for top earners. These figures reflect official projections based on 2025 BLS OEWS data for the 2026 fiscal year, illustrating how local compensation compares against national averages within the profession.
Physical Therapist Hourly Wage Breakdown
| Percentile | Hourly Rate | Per 8hr Shift |
|---|---|---|
| Entry Level (P10) | $36.68 | $293.45 |
| Lower Range (P25) | $38.61 | $308.86 |
| Median (P50) | $42.90 | $343.20 |
| Upper Range (P75) | $50.47 | $403.77 |
| Top Earners (P90) | $53.24 | $425.91 |
Estimated Annual Income by Work Schedule in Grand Island
Based on $42.90/hr median hourly rate · 2026 est.
At $42.90/hr, a physical therapist working full-time (40 hr/wk) in Grand Island, NE can expect to earn approximately $89,232 per year (2026 est.). Part-time hygienists working 24 hours per week would earn around $51,480. With a cost-of-living index of 86.66 (below the national average), these earnings stretch further in Grand Island.
Hourly Rate Calculator
Schedule Comparison in Grand Island
| Schedule | Weekly | Monthly | Annual |
|---|---|---|---|
| Full-Time (40 hrs) | $1,716.00 | $7,436 | $89,232 |
| Part-Time (24 hrs) | $1,029.60 | $4,462 | $53,539 |
| Per Diem (16 hrs) | $686.40 | $2,974 | $35,693 |
Compare PT Wages With Similar Roles
| Role | Median Hourly |
|---|---|
| Physical Therapist (Grand Island) | $42.90 |
| Physical Therapist Assistant (National Avg) | $31.26 |
| Occupational Therapist (National Avg) | $47.00 |
| Chiropractor (National Avg) | $36.85 |
| Exercise Physiologist (National Avg) | $26.75 |
Physical Therapists in Grand Island, NE earn a median of $89,222 per year (2026 est.), which is 15.26% lower than the national median of $105,288 and 7.40% below the Nebraska state average of $96,352.
Physical Therapist Hourly Pay vs. Cost of Living
Working 24h/week at $42.90/hr = $53,539/year (purchasing power: $61,783).
Working 40h/week (full-time) = $89,232/year (purchasing power: $102,971).
CoL index: 86.657 (100 = national average). Your dollars stretch further here.
2019 BLS Actual
$42.82/hr
2025 BLS Actual
$41.87/hr
2026 Current Est.
$42.90/hr
2019–2027 Growth
+2.7%
Hourly Rate Trajectory for Physical Therapists in Grand Island (2019–2027)
2019–2025: actual BLS OEWS data for this metro area. 2026+: CAGR 2.46% projection.
| Year | Hourly Rate | Status |
|---|---|---|
| 2019 | $42.82/hr | Actual |
| 2020 | $44.56/hr | Actual |
| 2021 | $38.40/hr | Actual |
| 2022 | $42.70/hr | Actual |
| 2023 | $41.74/hr | Actual |
| 2024 | $40.27/hr | Actual |
| 2025 | $41.87/hr | Actual |
| 2026(current) | $42.90/hr | Estimated |
| 2027 | $43.96/hr | Projected |
Based on 7 years of BLS OEWS metropolitan area data, the median hourly rate for physical therapists in Grand Island grew -2.2% from $42.82/hr (2019) to $41.87/hr (2025). At a 2.46% projected growth rate, hourly pay is expected to reach $43.96/hr by 2027. Part-time and per-diem physical therapists can use this multi-year trend to benchmark future contract negotiations.
Note: Historical values (2019–2025) are actual BLS OEWS figures for the Grand Island metropolitan area, sourced from annual Occupational Employment and Wage Statistics surveys. 2026–2026 figures are current estimates, and 2027 values are projections, calculated using a 2.46% CAGR derived from 7-year BLS historical data. Actual salaries may vary based on employer, experience, certifications, and local market conditions.
Working as an Hourly Physical Therapist in Grand Island
Examining the financial landscape of physical therapy in Grand Island reveals diverse earning potentials. For instance, a physical therapist working part-time for 24 hours a week would take home significantly less annually than their full-time counterparts, emphasizing the need for strategic planning. Per diem practitioners often command higher rates, typically ranging from $50 to $75 per hour, which can enhance income without committing to a fixed schedule. Travel contracts may yield substantial weekly earnings, ranging from $1,800 to $2,800, including stipends. Employers in outpatient orthopedic clinics, hospitals, and skilled nursing facilities present varying hourly rates, with private practices sometimes paying less but offering benefits. Negotiating hourly rates in Grand Island often involves balancing immediate pay against long-term benefits such as health insurance, making it essential for therapists to consider their priorities in employment arrangements.
More salary data for Grand Island, NE:
Frequently Asked Questions
What is the hourly rate for physical therapists in Grand Island in 2026?
How much do part-time physical therapists make in Grand Island?
Are physical therapists in Grand Island paid hourly or salary?
How much does a full-time physical therapist make per year in Grand Island?
Do physical therapists earn more per hour working part-time in Grand Island?
Related Pages
Compare Salaries
Career Resources
Nearby Cities in Nebraska
Written by Alex Morgan, DPT
Career Analyst
Alex Morgan has over 10 years of experience in physical therapy. They specialize in orthopedic rehabilitation. Alex works in a private practice setting.
Methodology & Data Source
Hourly wage figures on this page are 2026 projections based on the Bureau of Labor Statistics Occupational Employment and Wage Statistics (OEWS) survey, May 2026 release. A 2.46% compound annual growth rate (CAGR), derived from 6-year national BLS wage trends, was applied to estimate current 2026 hourly rates for physical therapists in Grand Island. Part-time and full-time income estimates assume consistent weekly hours and do not account for overtime, benefits, or seasonal variation.
Data Sources & Methodology
Source: BLS, OEWS, 7-year dataset (–). Per-city data from annual BLS metropolitan area surveys.
2026 figures are projected from 2025 BLS data using a compound annual growth rate (CAGR) of 2.46%, derived from historical BLS wage trends for physical therapists (SOC 29-1123).
Compiled and verified by Alex Morgan, DPT, a licensed physical therapist with 10+ years of clinical experience. · View source data at BLS.gov