Physical Therapist Hourly Pay in North Richland Hills, TX: $49.91 (2026)
Quick Answer:Hourly pay for a physical therapist working in North Richland Hills, TX runs $49.91 at the median for 2026 — annualizing to $103,811 at a standard 2,080-hour year. Figures projected from BLS OEWS 2025 (SOC 29-1123). Weighted against North Richland Hills's regional price level (BEA RPP 96.0, 4% below national), each hour of work buys what $51.99 nationally would. A 24-hour part-time schedule grosses $62,286 per year.
Based on BLS state-level estimates · View source
In 2026, physical therapists in North Richland Hills, TX, will earn a median hourly rate of $49.91. This figure is slightly below the national median of $50.62, reflecting the local economic landscape. For part-time therapists working three days a week, this hourly pay can accumulate to a substantial income, particularly in settings like outpatient clinics, inpatient rehabilitation units, and skilled nursing facilities, where they provide impactful care. The hourly rate ranges from $37.93 for entry-level positions up to $64.84 for top earners. The hourly wages reported are derived from annual salary estimates and highlight the potential earnings depending on experience and workplace dynamics.
About the North Richland Hills Market
Salary estimated from Texas average ($100,000) adjusted for local cost of living.
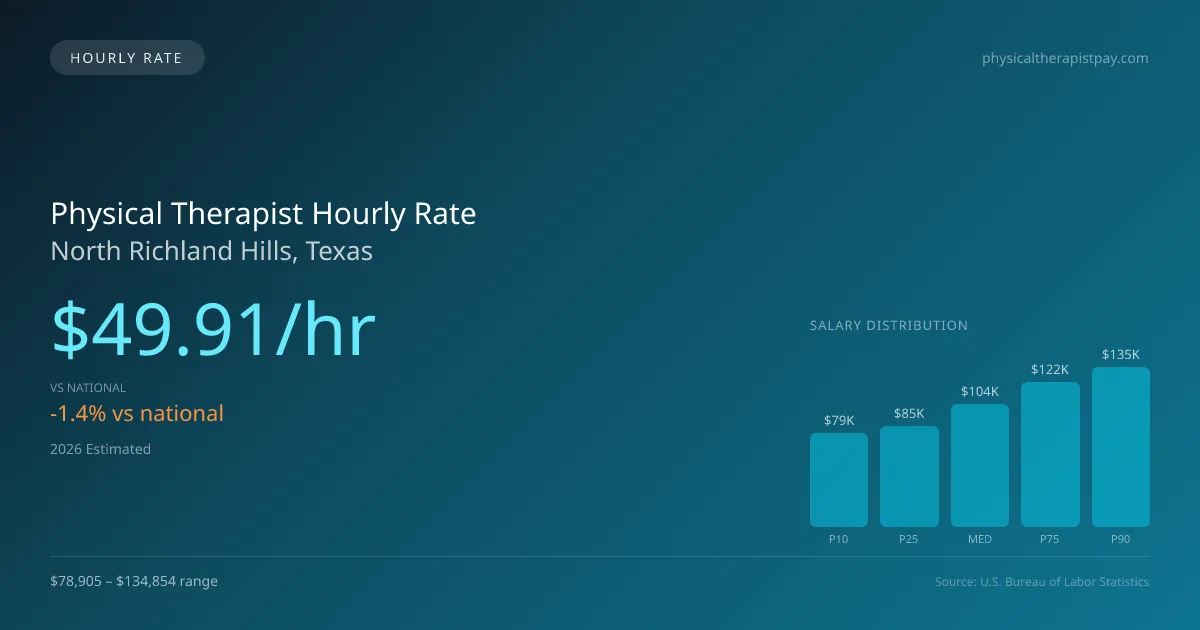
Physical Therapist Hourly Wage Breakdown
| Percentile | Hourly Rate | Per 8hr Shift |
|---|---|---|
| Entry Level (P10) | $37.93 | $303.45 |
| Lower Range (P25) | $40.73 | $325.82 |
| Median (P50) | $49.91 | $399.27 |
| Upper Range (P75) | $58.59 | $468.69 |
| Top Earners (P90) | $64.84 | $518.69 |
Estimated Annual Income by Work Schedule in North Richland Hills
Based on $49.91/hr median hourly rate · 2026 est.
At $49.91/hr, a physical therapist working full-time (40 hr/wk) in North Richland Hills, TX can expect to earn approximately $103,809 per year (2026 est.). Part-time hygienists working 24 hours per week would earn around $59,890. With a cost-of-living index of 96.00 (below the national average), these earnings stretch further in North Richland Hills.
Hourly Rate Calculator
Schedule Comparison in North Richland Hills
| Schedule | Weekly | Monthly | Annual |
|---|---|---|---|
| Full-Time (40 hrs) | $1,996.33 | $8,651 | $103,809 |
| Part-Time (24 hrs) | $1,197.80 | $5,190 | $62,286 |
| Per Diem (16 hrs) | $798.53 | $3,460 | $41,524 |
Compare PT Wages With Similar Roles
| Role | Median Hourly |
|---|---|
| Physical Therapist (North Richland Hills) | $49.91 |
| Physical Therapist Assistant (National Avg) | $31.26 |
| Occupational Therapist (National Avg) | $47.00 |
| Chiropractor (National Avg) | $36.85 |
| Exercise Physiologist (National Avg) | $26.75 |
Physical Therapists in North Richland Hills, TX earn a median of $103,811 per year (2026 est.), which is 1.40% lower than the national median of $105,288 and 3.10% below the Texas state average of $107,133.
Physical Therapist Hourly Pay vs. Cost of Living
Working 24h/week at $49.91/hr = $62,286/year (purchasing power: $64,881).
Working 40h/week (full-time) = $103,809/year (purchasing power: $108,135).
CoL index: 96 (100 = national average). Your dollars stretch further here.
2019 BLS Actual
$42.40/hr
2025 BLS Actual
$48.71/hr
2026 Current Est.
$49.91/hr
2019–2027 Growth
+20.6%
Hourly Rate Trajectory for Physical Therapists in North Richland Hills (2019–2027)
2019–2025: actual BLS OEWS data for this metro area. 2026+: CAGR 2.46% projection.
| Year | Hourly Rate | Status |
|---|---|---|
| 2019 | $42.40/hr | Actual |
| 2020 | $43.14/hr | Actual |
| 2021 | $45.33/hr | Actual |
| 2022 | $46.32/hr | Actual |
| 2023 | $47.26/hr | Actual |
| 2024 | $44.71/hr | Actual |
| 2025 | $48.71/hr | Actual |
| 2026(current) | $49.91/hr | Estimated |
| 2027 | $51.14/hr | Projected |
Based on 7 years of BLS OEWS metropolitan area data, the median hourly rate for physical therapists in North Richland Hills grew 14.9% from $42.40/hr (2019) to $48.71/hr (2025). At a 2.46% projected growth rate, hourly pay is expected to reach $51.14/hr by 2027. Part-time and per-diem physical therapists can use this multi-year trend to benchmark future contract negotiations.
Note: Historical values (2019–2025) are actual BLS OEWS figures for the North Richland Hills metropolitan area, sourced from annual Occupational Employment and Wage Statistics surveys. 2026–2026 figures are current estimates, and 2027 values are projections, calculated using a 2.46% CAGR derived from 7-year BLS historical data. Actual salaries may vary based on employer, experience, certifications, and local market conditions.
Working as an Hourly Physical Therapist in North Richland Hills
Considering the part-time and per diem flexibility for therapists, those working 24 hours a week can realistically take home a significant income, though less than their full-time counterparts. Many physical therapists engage in per diem work, with typical rates correlating between $50-$75 per hour. For traveling positions, which are popular among mobile therapists, contracts can reach $1,800 to $2,800 weekly. It's important to note that hourly rates can diverge based on various employer types in North Richland Hills, with outpatient orthopedic clinics often offering less than hospital systems, but with additional incentives such as productivity bonuses. Physical therapists must weigh their hourly rates against benefits like health insurance when considering job offers. For those negotiating their pay, demonstrating specialized skills or pursuing opportunities in cash-pay settings can be essential strategies for maximizing earnings.
More salary data for North Richland Hills, TX:
Frequently Asked Questions
What is the hourly rate for physical therapists in North Richland Hills in 2026?
How much do part-time physical therapists make in North Richland Hills?
Are physical therapists in North Richland Hills paid hourly or salary?
How much does a full-time physical therapist make per year in North Richland Hills?
Do physical therapists earn more per hour working part-time in North Richland Hills?
Related Pages
Compare Salaries
Career Resources
Nearby Cities in Texas
Written by Alex Morgan, DPT
Career Analyst
Alex Morgan has over 10 years of experience in physical therapy. They specialize in orthopedic rehabilitation. Alex works in a private practice setting.
Methodology & Data Source
Hourly wage figures on this page are 2026 projections based on the Bureau of Labor Statistics Occupational Employment and Wage Statistics (OEWS) survey, May 2026 release. A 2.46% compound annual growth rate (CAGR), derived from 6-year national BLS wage trends, was applied to estimate current 2026 hourly rates for physical therapists in North Richland Hills. Part-time and full-time income estimates assume consistent weekly hours and do not account for overtime, benefits, or seasonal variation.
Data Sources & Methodology
Salary data for North Richland Hills is estimated from official BLS state-level occupational wage data (2025), adjusted for regional cost-of-living differences using BEA RPP (Regional Price Parities).
2026 figures are projected from 2025 BLS data using a compound annual growth rate (CAGR) of 2.46%, derived from historical BLS wage trends for physical therapists (SOC 29-1123).
Compiled and verified by Alex Morgan, DPT, a licensed physical therapist with 10+ years of clinical experience. · View source data at BLS.gov