Physical Therapist Hourly Pay in Richmond, VA: $50.58 (2026)
Quick Answer:Hourly pay for a physical therapist working in Richmond, VA runs $50.58 at the median for 2026 — annualizing to $105,226 at a standard 2,080-hour year. Figures projected from BLS OEWS 2025 (SOC 29-1123). Weighted against Richmond's regional price level (BEA RPP 97.9, 2% below national), each hour of work buys what $51.69 nationally would. A 24-hour part-time schedule grosses $63,129 per year.
Official BLS data · View source
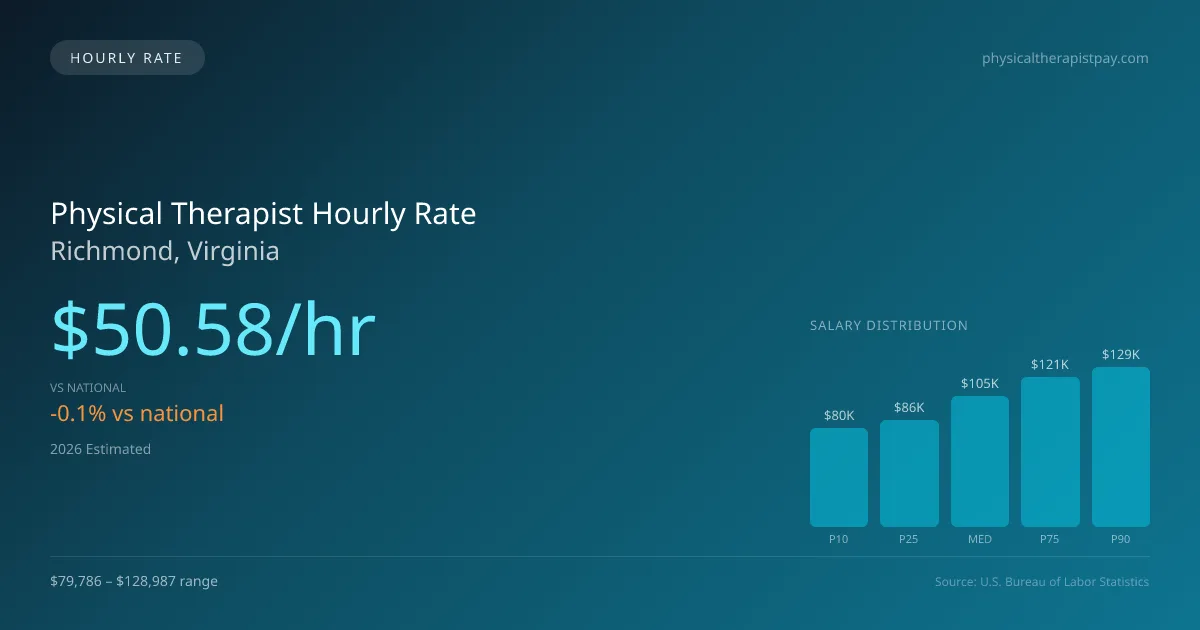
In Richmond, Virginia, the physical therapist hourly pay is projected to be $50.58 in 2026, which is slightly below the national average of $50.62 per hour. This competitive rate provides a solid income for part-time professionals working three days a week in various settings, such as outpatient clinics, inpatient rehabilitation units, and home health environments. For physical therapists who take on per-diem roles, this hourly rate translates into approximately $1,195 weekly for a full-time schedule. Within the Richmond area, hourly earnings can range from $38.36 for entry-level positions to $62.01 for those at the top of their field, indicating a healthy potential for earnings based on experience and specialization. These figures are derived from official Bureau of Labor Statistics (BLS) data.
Physical Therapist Hourly Wage Breakdown
| Percentile | Hourly Rate | Per 8hr Shift |
|---|---|---|
| Entry Level (P10) | $38.36 | $306.89 |
| Lower Range (P25) | $41.32 | $330.58 |
| Median (P50) | $50.58 | $404.68 |
| Upper Range (P75) | $58.31 | $466.48 |
| Top Earners (P90) | $62.01 | $496.07 |
Estimated Annual Income by Work Schedule in Richmond
Based on $50.58/hr median hourly rate · 2026 est.
At $50.58/hr, a physical therapist working full-time (40 hr/wk) in Richmond, VA can expect to earn approximately $105,216 per year (2026 est.). Part-time hygienists working 24 hours per week would earn around $60,701. With a cost-of-living index of 97.86 (below the national average), these earnings stretch further in Richmond.
Hourly Rate Calculator
Schedule Comparison in Richmond
| Schedule | Weekly | Monthly | Annual |
|---|---|---|---|
| Full-Time (40 hrs) | $2,023.38 | $8,768 | $105,216 |
| Part-Time (24 hrs) | $1,214.03 | $5,261 | $63,129 |
| Per Diem (16 hrs) | $809.35 | $3,507 | $42,086 |
Compare PT Wages With Similar Roles
| Role | Median Hourly |
|---|---|
| Physical Therapist (Richmond) | $50.58 |
| Physical Therapist Assistant (National Avg) | $31.26 |
| Occupational Therapist (National Avg) | $47.00 |
| Chiropractor (National Avg) | $36.85 |
| Exercise Physiologist (National Avg) | $26.75 |
Physical Therapists in Richmond, VA earn a median of $105,226 per year (2026 est.), which is 0.06% lower than the national median of $105,288 and 0.30% above the Virginia state average of $104,912.
Physical Therapist Hourly Pay vs. Cost of Living
Working 24h/week at $50.58/hr = $63,129/year (purchasing power: $64,511).
Working 40h/week (full-time) = $105,216/year (purchasing power: $107,519).
CoL index: 97.858 (100 = national average). Your dollars stretch further here.
2019 BLS Actual
$46.60/hr
2025 BLS Actual
$49.37/hr
2026 Current Est.
$50.58/hr
2019–2027 Growth
+11.2%
Hourly Rate Trajectory for Physical Therapists in Richmond (2019–2027)
2019–2025: actual BLS OEWS data for this metro area. 2026+: CAGR 2.46% projection.
| Year | Hourly Rate | Status |
|---|---|---|
| 2019 | $46.60/hr | Actual |
| 2020 | $47.41/hr | Actual |
| 2021 | $45.97/hr | Actual |
| 2022 | $47.52/hr | Actual |
| 2023 | $46.02/hr | Actual |
| 2024 | $48.55/hr | Actual |
| 2025 | $49.37/hr | Actual |
| 2026(current) | $50.58/hr | Estimated |
| 2027 | $51.83/hr | Projected |
Based on 7 years of BLS OEWS metropolitan area data, the median hourly rate for physical therapists in Richmond grew 5.9% from $46.60/hr (2019) to $49.37/hr (2025). At a 2.46% projected growth rate, hourly pay is expected to reach $51.83/hr by 2027. Part-time and per-diem physical therapists can use this multi-year trend to benchmark future contract negotiations.
Note: Historical values (2019–2025) are actual BLS OEWS figures for the Richmond metropolitan area, sourced from annual Occupational Employment and Wage Statistics surveys. 2026–2026 figures are current estimates, and 2027 values are projections, calculated using a 2.46% CAGR derived from 7-year BLS historical data. Actual salaries may vary based on employer, experience, certifications, and local market conditions.
Working as an Hourly Physical Therapist in Richmond
Beyond the straightforward pay structure, Richmond’s physical therapy landscape offers a nuanced earning potential depending on part-time work, agency positions, or direct-pay setups. A physical therapist working part-time at 24 hours per week might earn about $53,371 annually, providing a reasonable salary while maintaining flexible hours. Per diem physical therapists in Richmond can see varied compensation, often charging between $50 to $75 per hour, with travel PTs earning considerably more in the $1,800 to $2,800 per week range depending on contract stipulations. While outpatient orthopedic clinics like ATI and Athletico may offer slightly lower hourly rates, therapists often weigh the trade-off between higher hourly pay without benefits and positions offering health insurance and paid leave. For thorough preparation, professionals should aim to negotiate their rates by emphasizing their qualifications and tailoring their asks based on their targeted employer type, whether it's a private practice or a large healthcare network.
More salary data for Richmond, VA:
Frequently Asked Questions
What is the hourly rate for physical therapists in Richmond in 2026?
How much do part-time physical therapists make in Richmond?
Are physical therapists in Richmond paid hourly or salary?
How much does a full-time physical therapist make per year in Richmond?
Do physical therapists earn more per hour working part-time in Richmond?
Related Pages
Compare Salaries
Career Resources
Nearby Cities in Virginia
Written by Alex Morgan, DPT
Career Analyst
Alex Morgan has over 10 years of experience in physical therapy. They specialize in orthopedic rehabilitation. Alex works in a private practice setting.
Methodology & Data Source
Hourly wage figures on this page are 2026 projections based on the Bureau of Labor Statistics Occupational Employment and Wage Statistics (OEWS) survey, May 2026 release. A 2.46% compound annual growth rate (CAGR), derived from 6-year national BLS wage trends, was applied to estimate current 2026 hourly rates for physical therapists in Richmond. Part-time and full-time income estimates assume consistent weekly hours and do not account for overtime, benefits, or seasonal variation.
Data Sources & Methodology
Source: BLS, OEWS, 7-year dataset (–). Per-city data from annual BLS metropolitan area surveys.
2026 figures are projected from 2025 BLS data using a compound annual growth rate (CAGR) of 2.46%, derived from historical BLS wage trends for physical therapists (SOC 29-1123).
Compiled and verified by Alex Morgan, DPT, a licensed physical therapist with 10+ years of clinical experience. · View source data at BLS.gov