Senior Physical Therapist Salary in Richmond, VA: $128,987 (2026)
Quick Answer:The top tier of physical therapists working in Richmond, VA — those at or above the 90th percentile — pull in $128,987/year or more for 2026, based on BLS OEWS 2025 estimates for SOC 29-1123. Strip back Richmond's price premium (BEA RPP 97.9, 2% below national) and that top-decile pay carries the same buying power as $131,810 in average-cost America. The 23% spread above city median typically rewards 7+ years of practice or specialty credentials.
Official BLS data · View source
In Richmond, VA, the potential for top-tier compensation for experienced physical therapists is substantial. With a 2026 projected salary for the top 10% of professionals reaching $128,987 annually, senior physical therapists can earn significantly more than the median salary of $105,226. This elevated earning potential reflects an experience premium that rewards those with over seven years in the field. Those aiming for the highest brackets typically do so through specialization, advanced certifications, and leadership positions. The gap between median salaries and top-tier compensation illustrates the financial benefits of continuing education and specialization in areas such as orthopedic and sports therapy.
2026 Salary Percentile Distribution in Richmond
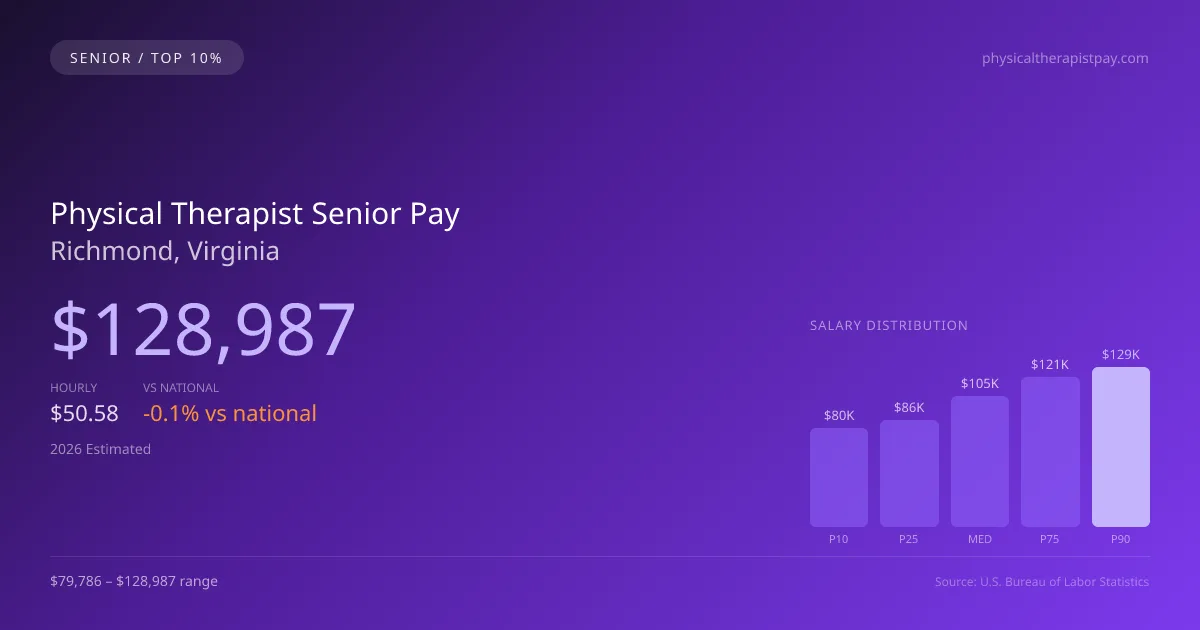
Experienced physical therapists at the top of the pay scale in Richmond earn between $121,282 and $128,987 per year (2026 est.). This $49,201 range from 10th to 90th percentile reflects significant earnings potential growth over a career. The Richmond median of $105,226 sits 0.06% below the US median.
Top PT Salary Comparison
| Level | Richmond | National |
|---|---|---|
| Median (P50) | $105,226 | $105,288 |
| 75th Percentile | $121,282 | $124,141 |
| 90th Percentile (Top 10%) | $128,987 | $138,464 |
In Richmond, experienced physical therapists (P90) earn 22.58% more than the local median — reflecting the significant value of specialization and tenure in this market.
What Drives Top Physical Therapist Pay in Richmond
Advanced Certifications in Virginia
VA physical therapists with additional specialty certifications within the physical therapy field earn significantly above the $105,226 median. Expanded-scope credentials are increasingly valued by Richmond employers.
Specialty Focus
Physical Therapists focusing on high-acuity or specialty areas within the physical therapy field in Richmond command premium compensation, often reaching the $121,282–$128,987 range.
Large Health-System & Multi-Site Experience
Large hospital systems and multi-site employers in the Richmond metro area, which is a large PT employment market, often pay above-market rates for experienced physical therapists who demonstrate efficiency and leadership.
Employer Loyalty & Patient Relationships
Long-tenured physical therapists in Richmond with established relationships have strong negotiating leverage. In this competitive market, retention bonuses and annual raises are common for top performers.
Continuing Education & Leadership
Physical Therapists in Virginia who pursue advanced degrees, mentor junior staff, or lead clinical education programs position themselves for the highest compensation tiers and management roles.
Physical Therapist Career & Wage Growth Path in Richmond
Clinical Physical Therapist
0-5 yearsSenior/Lead Physical Therapist
5-10 yearsPhysical Therapist Department Manager
10+ yearsEducator / Specialty Leadership
AdvancedRichmond ranks #24 of 42 Virginia cities for top earner physical therapist salary (90th percentile: $128,987).
Top 10% physical therapist compensation in Richmond ($128,987) is 1.29% below the Virginia average P90 ($130,676).
2019 BLS Actual
$129,520
2025 BLS Actual
$125,890
2026 Current Est.
$128,987
2019–2027 Growth
+2.0%
Salary Trajectory for Physical Therapists in Richmond (2019–2027)
2019–2025: actual BLS OEWS data for this metro area. 2026+: CAGR 2.46% projection.
| Year | Annual Salary | Status |
|---|---|---|
| 2019 | $129,520 | Actual |
| 2020 | $133,530 | Actual |
| 2021 | $120,800 | Actual |
| 2022 | $124,120 | Actual |
| 2023 | $128,380 | Actual |
| 2024 | $126,510 | Actual |
| 2025 | $125,890 | Actual |
| 2026(current) | $128,987 | Estimated |
| 2027 | $132,160 | Projected |
Top-earning physical therapists (90th percentile) in Richmond saw their compensation grow -2.8% from $129,520 in 2019 to $125,890 in 2025, based on 7 years of BLS OEWS data for this metropolitan area. At a 2.46% annual growth rate, senior-level pay is projected to reach $132,160 by 2027, reflecting continued demand for clinical expertise and expanded-function credentials.
Note: Historical values (2019–2025) are actual BLS OEWS figures for the Richmond metropolitan area, sourced from annual Occupational Employment and Wage Statistics surveys. 2026–2026 figures are current estimates, and 2027 values are projections, calculated using a 2.46% CAGR derived from 7-year BLS historical data. Actual salaries may vary based on employer, experience, certifications, and local market conditions.
Maximizing Your Physical Therapist Earnings in Richmond
Compensation for senior physical therapists in Richmond can vary widely across different work settings. Outpatient clinics, particularly those under larger chains like ATI or Athletico, may offer competitive salaries but often include productivity bonuses that can enhance overall earnings. In contrast, hospital inpatient rehabilitation settings might offer more stability and lower productivity expectations but can also lead to higher salaries for those in leadership roles. Specializations like orthopedics (OCS) or neurology (NCS) can demand higher pay, reflecting the expertise and demand for these skills in the health landscape. Further enhancing earning potential, advanced credentials such as a Doctor of Physical Therapy (DPT) from a CAPTE-accredited program or board certifications can lead to elevated roles, with financial incentives like stipends for board certifications or profit-sharing models in private practices. The market in Richmond thus supports a variety of compensation strategies, allowing experienced physical therapists to maximize their incomes effectively.
More salary data for Richmond, VA:
Frequently Asked Questions
How much do experienced physical therapists make in Richmond in 2026?
What drives higher physical therapist pay in Richmond?
What certifications boost physical therapist salary in Richmond?
Can experienced physical therapists make six figures in Richmond?
How much does physical therapist salary increase over time in Richmond?
Related Pages
Compare Salaries
Career Resources
Nearby Cities in Virginia
Written by Alex Morgan, DPT
Career Analyst
Alex Morgan has over 10 years of experience in physical therapy. They specialize in orthopedic rehabilitation. Alex works in a private practice setting.
Methodology & Data Source
Top-earner salary figures on this page are 2026 projections derived from the Bureau of Labor Statistics Occupational Employment and Wage Statistics (OEWS) survey, May 2026 release. BLS reported a 90th percentile salary of $125,890 for physical therapists in the Richmond metro area. A 2.46% compound annual growth rate (CAGR), calculated from 6-year national BLS wage trends, was applied to project current 2026 senior-level compensation. Individual earnings depend on certifications, specialization, practice type, and years of clinical experience.
Data Sources & Methodology
Source: BLS, OEWS, 7-year dataset (–). Per-city data from annual BLS metropolitan area surveys.
2026 figures are projected from 2025 BLS data using a compound annual growth rate (CAGR) of 2.46%, derived from historical BLS wage trends for physical therapists (SOC 29-1123).
Compiled and verified by Alex Morgan, DPT, a licensed physical therapist with 10+ years of clinical experience. · View source data at BLS.gov