Physical Therapist Hourly Pay in Lynnwood, WA: $51.09 (2026)
Quick Answer:Hourly pay for a physical therapist working in Lynnwood, WA runs $51.09 at the median for 2026 — annualizing to $106,252 at a standard 2,080-hour year. Figures projected from BLS OEWS 2025 (SOC 29-1123). Weighted against Lynnwood's regional price level (BEA RPP 107.4, 7% above national), each hour of work buys what $47.57 nationally would. A 24-hour part-time schedule grosses $63,756 per year.
Based on BLS state-level estimates · View source
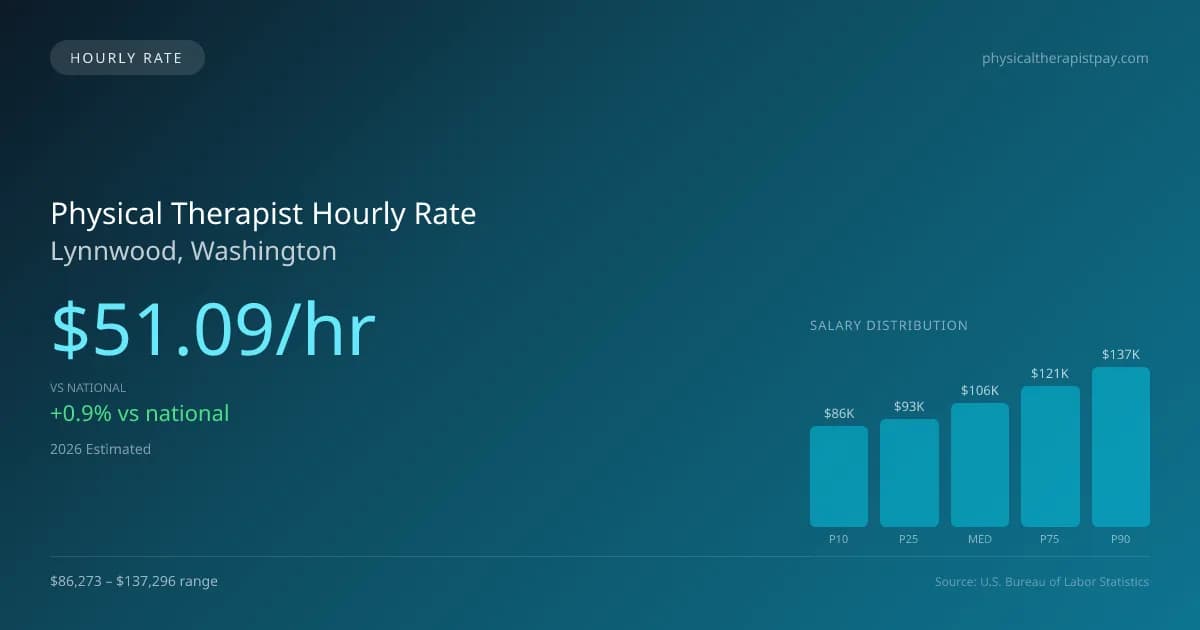
In Lynnwood, Washington, physical therapists earn a median hourly rate of $51.09, which marginally exceeds the national median of $50.62. This competitive rate reflects the healthcare market's dynamics in various settings, including outpatient clinics, hospital rehabilitation units, skilled nursing facilities, and home health care. For those considering part-time or per-diem work, such as three days a week, the hourly pay presents substantial earning potential. Entry-level physical therapists may start at around $41.48 an hour, but more experienced practitioners can command rates up to $66.00. As these hourly figures are projected from annual salary estimates, they indicate a favorable outlook for those pursuing physical therapy careers in the area while providing flexibility for diverse work arrangements.
About the Lynnwood Market
Salary estimated from Washington average ($99,000) adjusted for local cost of living.
Physical Therapist Hourly Wage Breakdown
| Percentile | Hourly Rate | Per 8hr Shift |
|---|---|---|
| Entry Level (P10) | $41.48 | $331.81 |
| Lower Range (P25) | $44.58 | $356.64 |
| Median (P50) | $51.09 | $408.69 |
| Upper Range (P75) | $58.26 | $466.07 |
| Top Earners (P90) | $66.00 | $528.04 |
Estimated Annual Income by Work Schedule in Lynnwood
Based on $51.09/hr median hourly rate · 2026 est.
At $51.09/hr, a physical therapist working full-time (40 hr/wk) in Lynnwood, WA can expect to earn approximately $106,260 per year (2026 est.). Part-time hygienists working 24 hours per week would earn around $61,304. With a cost-of-living index of 107.40 (above the national average), these earnings may be offset by higher expenses in Lynnwood.
Hourly Rate Calculator
Schedule Comparison in Lynnwood
| Schedule | Weekly | Monthly | Annual |
|---|---|---|---|
| Full-Time (40 hrs) | $2,043.46 | $8,855 | $106,260 |
| Part-Time (24 hrs) | $1,226.08 | $5,313 | $63,756 |
| Per Diem (16 hrs) | $817.38 | $3,542 | $42,504 |
Compare PT Wages With Similar Roles
| Role | Median Hourly |
|---|---|
| Physical Therapist (Lynnwood) | $51.09 |
| Physical Therapist Assistant (National Avg) | $31.26 |
| Occupational Therapist (National Avg) | $47.00 |
| Chiropractor (National Avg) | $36.85 |
| Exercise Physiologist (National Avg) | $26.75 |
Physical Therapists in Lynnwood, WA earn a median of $106,252 per year (2026 est.), which is 0.92% higher than the national median of $105,288 and 3.30% below the Washington state average of $109,878.
Physical Therapist Hourly Pay vs. Cost of Living
Working 24h/week at $51.09/hr = $63,756/year (purchasing power: $59,363).
Working 40h/week (full-time) = $106,260/year (purchasing power: $98,939).
CoL index: 107.4 (100 = national average).
2019 BLS Actual
$43.40/hr
2025 BLS Actual
$49.86/hr
2026 Current Est.
$51.09/hr
2019–2027 Growth
+20.6%
Hourly Rate Trajectory for Physical Therapists in Lynnwood (2019–2027)
2019–2025: actual BLS OEWS data for this metro area. 2026+: CAGR 2.46% projection.
| Year | Hourly Rate | Status |
|---|---|---|
| 2019 | $43.40/hr | Actual |
| 2020 | $44.16/hr | Actual |
| 2021 | $46.40/hr | Actual |
| 2022 | $47.41/hr | Actual |
| 2023 | $48.38/hr | Actual |
| 2024 | $49.41/hr | Actual |
| 2025 | $49.86/hr | Actual |
| 2026(current) | $51.09/hr | Estimated |
| 2027 | $52.34/hr | Projected |
Based on 7 years of BLS OEWS metropolitan area data, the median hourly rate for physical therapists in Lynnwood grew 14.9% from $43.40/hr (2019) to $49.86/hr (2025). At a 2.46% projected growth rate, hourly pay is expected to reach $52.34/hr by 2027. Part-time and per-diem physical therapists can use this multi-year trend to benchmark future contract negotiations.
Note: Historical values (2019–2025) are actual BLS OEWS figures for the Lynnwood metropolitan area, sourced from annual Occupational Employment and Wage Statistics surveys. 2026–2026 figures are current estimates, and 2027 values are projections, calculated using a 2.46% CAGR derived from 7-year BLS historical data. Actual salaries may vary based on employer, experience, certifications, and local market conditions.
Working as an Hourly Physical Therapist in Lynnwood
Exploring the job landscape for physical therapists in Lynnwood reveals compelling insights into earning opportunities and employer expectations. A physical therapist working three days a week, logging 24 hours, could take home approximately $62,717 annually, which is significantly lower than salaries for full-time positions but allows for a healthier work-life balance. Per diem physical therapists typically earn between $50-$75 per hour, while those involved in travel contracts might see weekly pay ranging from $1,800 to $2,800, benefiting significantly from stipends. In contrast, cash-pay specialists in high-cost areas, such as sports and orthopedic practitioners, can set rates between $150 and $250, often bypassing traditional insurance models. Hourly earnings can vary substantially depending on the type of employer; outpatient clinics, like those under larger chains such as Athletico, may offer lower pay than hospital-based rehab facilities. Physical therapists must consider the trade-off between higher hourly rates without benefits and positions with comprehensive health insurance. Useful negotiation tips include researching industry standards, understanding the employer's financial health, and emphasizing skills in productivity models recognized by organizations like the APTA.
More salary data for Lynnwood, WA:
Frequently Asked Questions
What is the hourly rate for physical therapists in Lynnwood in 2026?
How much do part-time physical therapists make in Lynnwood?
Are physical therapists in Lynnwood paid hourly or salary?
How much does a full-time physical therapist make per year in Lynnwood?
Do physical therapists earn more per hour working part-time in Lynnwood?
Related Pages
Compare Salaries
Career Resources
Nearby Cities in Washington
Written by Alex Morgan, DPT
Career Analyst
Alex Morgan has over 10 years of experience in physical therapy. They specialize in orthopedic rehabilitation. Alex works in a private practice setting.
Methodology & Data Source
Hourly wage figures on this page are 2026 projections based on the Bureau of Labor Statistics Occupational Employment and Wage Statistics (OEWS) survey, May 2026 release. A 2.46% compound annual growth rate (CAGR), derived from 6-year national BLS wage trends, was applied to estimate current 2026 hourly rates for physical therapists in Lynnwood. Part-time and full-time income estimates assume consistent weekly hours and do not account for overtime, benefits, or seasonal variation.
Data Sources & Methodology
Salary data for Lynnwood is estimated from official BLS state-level occupational wage data (2025), adjusted for regional cost-of-living differences using BEA RPP (Regional Price Parities).
2026 figures are projected from 2025 BLS data using a compound annual growth rate (CAGR) of 2.46%, derived from historical BLS wage trends for physical therapists (SOC 29-1123).
Compiled and verified by Alex Morgan, DPT, a licensed physical therapist with 10+ years of clinical experience. · View source data at BLS.gov