Physical Therapist Salary in Lynnwood, WA: $106,252 (2026)
Quick Answer:A full-time physical therapist in Lynnwood, WA earns a median $106,252/year (≈ $51.09/hour) in nominal terms for 2026 — projected from BLS OEWS 2025 (SOC 29-1123). Once you factor in Lynnwood's price level (7% above national, BEA RPP 107.4), that paycheck buys what $98,931 would nationally. Nominal pay sits 3.3% below the Washington state average.
Based on BLS state-level estimates · View source
For 2026, the projected annual salary for physical therapists in Lynnwood, Washington, reaches a notable $106,252, slightly above the national median of $105,288, reflecting a 0.92% increase. This compensation framework is characterized by a salary range from $86,273 at the 10th percentile to $137,296 at the 90th percentile. These figures derive from estimates based on 2025 BLS data and take into account regional cost adjustments. As cash-pay models gain traction in the physical therapy market, particularly among sports and orthopedic specialists, salaries at the upper end of the scale are increasingly influenced by such privatized practices in Lynnwood. The local job market demonstrates a strong demand for physical therapists, signaling a promising outlook for professionals in the area.
About the Lynnwood Market
Salary estimated from Washington average ($99,000) adjusted for local cost of living.
Salary Breakdown
| Percentile | Annual | Hourly |
|---|---|---|
| Entry Level (P10) | $86,273 | $41.48 |
| Lower Range (P25) | $92,718 | $44.58 |
| Median (P50)(typical) | $106,252 | $51.09 |
| Upper Range (P75) | $121,169 | $58.26 |
| Top Earners (P90) | $137,296 | $66.00 |
Median Salary Position
0.92% above the national average
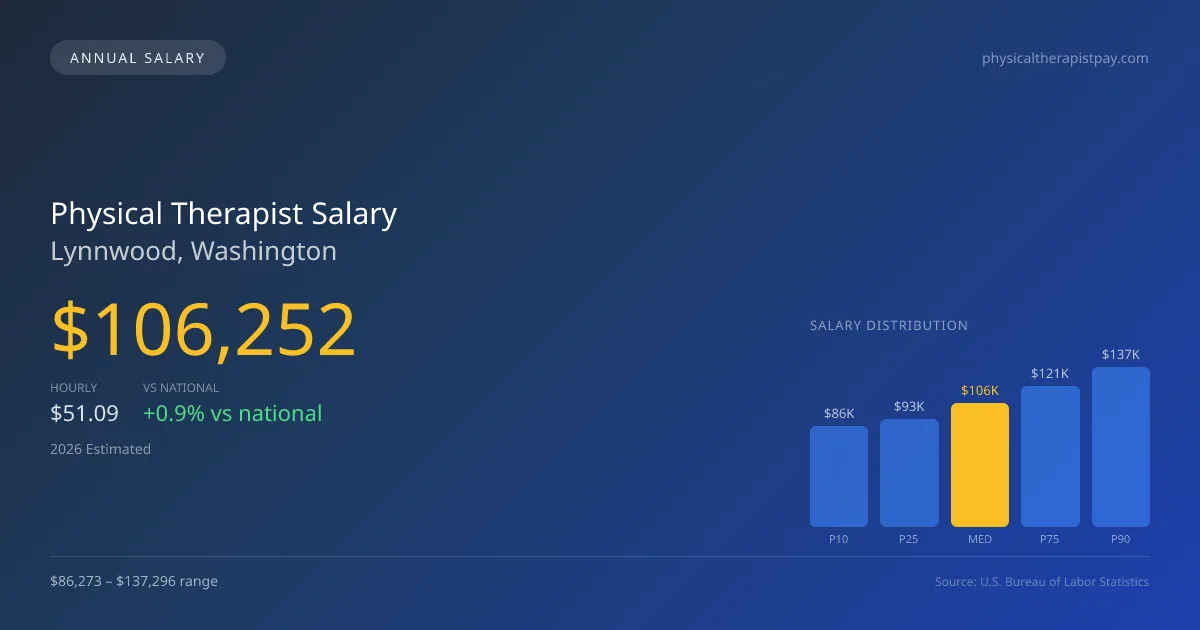
2026 Salary Percentile Distribution in Lynnwood
In Lynnwood, WA, the physical therapist salary spread from the 10th to 90th percentile is $51,023 (2026 est.). At $106,252, the local median is 0.92% above the national median of $105,288.
Salary Calculator
At 40 hours/week in Lynnwood: You'd be in the lower-middle range
How Lynnwood Physical Therapist Pay Compares
Lynnwood median: $106,252/year (2026)
| Compared To | Median Salary | Lynnwood Pays |
|---|---|---|
| Washington Average | $109,878 | -3.30% less |
| National Average | $105,288 | +0.92% more |
Physical Therapists in Lynnwood, WA earn a median of $106,252 per year (2026 est.), which is 0.92% higher than the national median of $105,288 and 3.30% below the Washington state average of $109,878.
Cost-of-Living Adjusted Salary
Lynnwood has a cost of living 7.40% above the national average.
Adjusted salary = nominal × (100 / CoL index). CoL index: 100 = national average.
Lynnwood, WA has a cost-of-living index of 107.4 (above the national average of 100). While the nominal salary of $106,252 is competitive, the higher cost of living reduces purchasing power to an effective $98,931 — a 6.89% reduction.
Compare Purchasing Power
Select a city to see how your salary compares after cost of living
Select a city above to compare purchasing power
2019 BLS Actual
$90,259
2025 BLS Actual
$103,701
2026 Current Est.
$106,252
2019–2027 Growth
+20.6%
Salary Trajectory for Physical Therapists in Lynnwood (2019–2027)
2019–2025: actual BLS OEWS data for this metro area. 2026+: CAGR 2.46% projection.
| Year | Annual Salary | Status |
|---|---|---|
| 2019 | $90,259 | Actual |
| 2020 | $91,843 | Actual |
| 2021 | $96,496 | Actual |
| 2022 | $98,615 | Actual |
| 2023 | $100,623 | Actual |
| 2024 | $102,769 | Actual |
| 2025 | $103,701 | Actual |
| 2026(current) | $106,252 | Estimated |
| 2027 | $108,866 | Projected |
Based on 7 years of BLS OEWS data for the Lynnwood metropolitan area, the median physical therapist salary grew 14.9% from $90,259 (2019) to $103,701 (2025). At a 2.46% compound annual growth rate, salaries are projected to reach $108,866 by 2027 — a total increase of $18,607 (20.62%) from 2019.
Note: Historical values (2019–2025) are actual BLS OEWS figures for the Lynnwood metropolitan area, sourced from annual Occupational Employment and Wage Statistics surveys. 2026–2026 figures are current estimates, and 2027 values are projections, calculated using a 2.46% CAGR derived from 7-year BLS historical data. Actual salaries may vary based on employer, experience, certifications, and local market conditions.
Salary by Experience Level
| Experience | Estimated Salary Range |
|---|---|
| 0-2 years (New Graduate) | $86,273 – $92,718 |
| 3-5 years (Mid Career) | $92,718 – $106,252 |
| 5+ years (Experienced) | $106,252 – $121,169 |
| 10+ years (Top Earner) | $121,169 – $137,296 |
PT salary ranges estimated from BLS percentile data. Individual physical therapist compensation varies by employer, certifications, and specialization.
Physical Therapist Job Market in Lynnwood
Within the current job market in Lynnwood, there are 6 physical therapists actively employed, contributing to the area's healthcare landscape. The cost of living index stands at 107.4, which surpasses the national average, meaning that although salaries are favorable, take-home pay may feel diminished when accounting for living expenses. Outpatient orthopedic clinics, especially larger chains like ATI and Athletico, often pay at the higher end of the spectrum, while hospital systems, skilled nursing facilities, and home health agencies tend to offer competitive packages as well. Variations in salary often stem from expectations related to productivity—how many units a therapist sees per visit and per day—as well as factors such as board certification stipends and ownership equity in clinics. To maximize earnings in this local market, physical therapists might benefit from pursuing board certifications like OCS or SCS and considering roles within cash-based practices, where reimbursement structures afford greater flexibility.
More salary data for Lynnwood, WA:
Frequently Asked Questions
How much do physical therapists make in Lynnwood, WA in 2026?
Is Lynnwood, WA a good place to work as a physical therapist?
Can physical therapists make $100K in Lynnwood?
What is the cost-of-living adjusted physical therapist salary in Lynnwood?
How much does a physical therapist make per hour in Lynnwood?
Related Pages
Compare Salaries
Career Resources
Nearby Cities in Washington
Written by Alex Morgan, DPT
Career Analyst
Alex Morgan has over 10 years of experience in physical therapy. They specialize in orthopedic rehabilitation. Alex works in a private practice setting.
Methodology & Data Source
Salary figures on this page are 2026 projections based on the Bureau of Labor Statistics Occupational Employment and Wage Statistics (OEWS) survey, May 2026 release. The BLS reported a median annual salary of $103,701 for physical therapistsin the Lynnwood metropolitan area. A 2.46% compound annual growth rate (CAGR), calculated from 6-year national BLS wage trends, was applied to project current 2026 compensation. Percentile ranges (P10–P90) represent the full salary distribution across experience levels and practice settings in this market.
Data Sources & Methodology
Salary data for Lynnwood is estimated from official BLS state-level occupational wage data (2025), adjusted for regional cost-of-living differences using BEA RPP (Regional Price Parities).
2026 figures are projected from 2025 BLS data using a compound annual growth rate (CAGR) of 2.46%, derived from historical BLS wage trends for physical therapists (SOC 29-1123).
Compiled and verified by Alex Morgan, DPT, a licensed physical therapist with 10+ years of clinical experience. · View source data at BLS.gov