Physical Therapist Salary in Benton, AR: $100,316 (2026)
Quick Answer:A full-time physical therapist in Benton, AR earns a median $100,316/year (≈ $48.23/hour) in nominal terms for 2026 — projected from BLS OEWS 2025 (SOC 29-1123). Once you factor in Benton's price level (13% below national, BEA RPP 86.9), that paycheck buys what $115,438 would nationally. Nominal pay sits 2.0% below the Arkansas state average.
Based on BLS state-level estimates · View source
In Benton, Arkansas, physical therapists can expect a median annual salary of $100,316 in 2026, which is slightly lower than the national median of $105,288. The salary range for physical therapists in this area spans from $75,099 at the P10 level to $126,325 at the P90 level. These figures, derived from 2025 BLS projections, account for regional cost adjustments and illustrate the market dynamics influenced by employer type. Outpatient orthopedic clinics, such as ATI and Athletico, typically offer lower pay compared to hospital systems, although they may have more flexible productivity bonuses. This structural choice significantly affects compensation strategies for physical therapists in Benton, as hospitals generally have larger budgets for rehabilitation services.
About the Benton Market
Salary estimated from Arkansas average ($88,000) adjusted for local cost of living.
Salary Breakdown
| Percentile | Annual | Hourly |
|---|---|---|
| Entry Level (P10) | $75,099 | $36.11 |
| Lower Range (P25) | $83,079 | $39.94 |
| Median (P50)(typical) | $100,316 | $48.23 |
| Upper Range (P75) | $115,925 | $55.74 |
| Top Earners (P90) | $126,325 | $60.74 |
Median Salary Position
4.72% below the national average
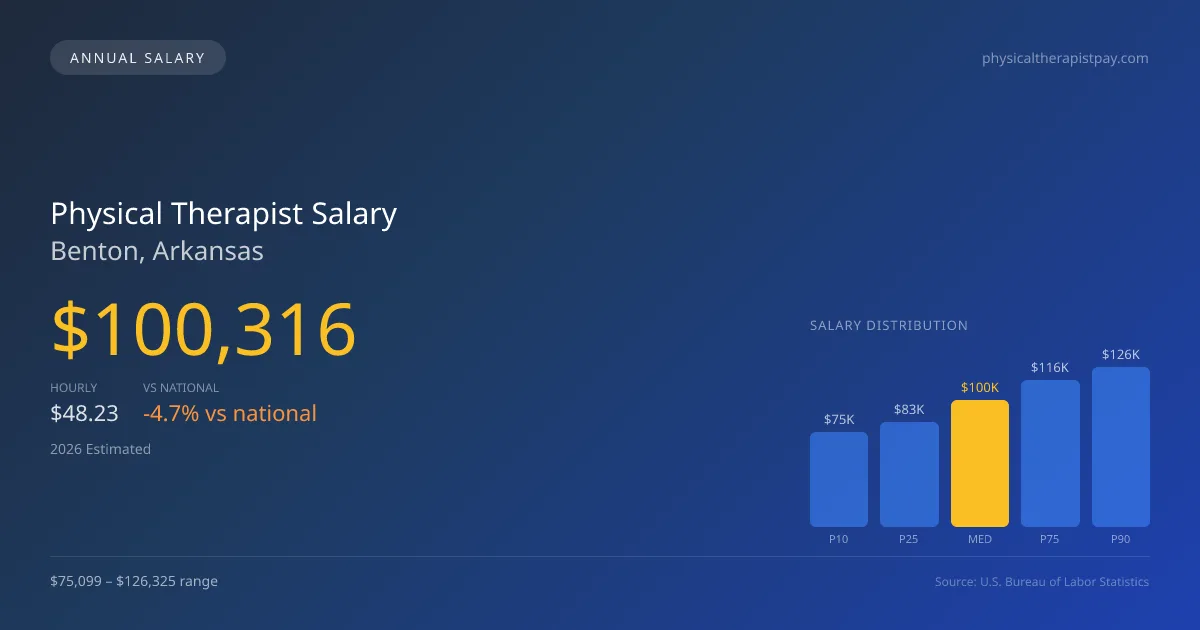
2026 Salary Percentile Distribution in Benton
In Benton, AR, the physical therapist salary spread from the 10th to 90th percentile is $51,226 (2026 est.). At $100,316, the local median is 4.72% below the national median of $105,288.
Salary Calculator
At 40 hours/week in Benton: You'd be in the lower-middle range
How Benton Physical Therapist Pay Compares
Benton median: $100,316/year (2026)
| Compared To | Median Salary | Benton Pays |
|---|---|---|
| Arkansas Average | $102,363 | -2.00% less |
| National Average | $105,288 | -4.72% less |
Physical Therapists in Benton, AR earn a median of $100,316 per year (2026 est.), which is 4.72% lower than the national median of $105,288 and 2.00% below the Arkansas state average of $102,363.
Cost-of-Living Adjusted Salary
Benton has a cost of living 13.10% below the national average, meaning your salary goes further here.
Adjusted salary = nominal × (100 / CoL index). CoL index: 100 = national average.
Benton, AR has a cost-of-living index of 86.9 (below the national average of 100). A physical therapist earning $100,316 nominally has purchasing power equivalent to $115,438 in an average-cost city — an effective 15.07% boost.
Compare Purchasing Power
Select a city to see how your salary compares after cost of living
Select a city above to compare purchasing power
2019 BLS Actual
$85,216
2025 BLS Actual
$97,907
2026 Current Est.
$100,316
2019–2027 Growth
+20.6%
Salary Trajectory for Physical Therapists in Benton (2019–2027)
2019–2025: actual BLS OEWS data for this metro area. 2026+: CAGR 2.46% projection.
| Year | Annual Salary | Status |
|---|---|---|
| 2019 | $85,216 | Actual |
| 2020 | $86,712 | Actual |
| 2021 | $91,104 | Actual |
| 2022 | $93,105 | Actual |
| 2023 | $95,001 | Actual |
| 2024 | $74,917 | Actual |
| 2025 | $97,907 | Actual |
| 2026(current) | $100,316 | Estimated |
| 2027 | $102,783 | Projected |
Based on 7 years of BLS OEWS data for the Benton metropolitan area, the median physical therapist salary grew 14.9% from $85,216 (2019) to $97,907 (2025). At a 2.46% compound annual growth rate, salaries are projected to reach $102,783 by 2027 — a total increase of $17,567 (20.61%) from 2019.
Note: Historical values (2019–2025) are actual BLS OEWS figures for the Benton metropolitan area, sourced from annual Occupational Employment and Wage Statistics surveys. 2026–2026 figures are current estimates, and 2027 values are projections, calculated using a 2.46% CAGR derived from 7-year BLS historical data. Actual salaries may vary based on employer, experience, certifications, and local market conditions.
Salary by Experience Level
| Experience | Estimated Salary Range |
|---|---|
| 0-2 years (New Graduate) | $75,099 – $83,079 |
| 3-5 years (Mid Career) | $83,079 – $100,316 |
| 5+ years (Experienced) | $100,316 – $115,925 |
| 10+ years (Top Earner) | $115,925 – $126,325 |
PT salary ranges estimated from BLS percentile data. Individual physical therapist compensation varies by employer, certifications, and specialization.
Physical Therapist Job Market in Benton
With only five physical therapists employed in the area, Benton’s job market for this profession appears modest but steady, buoyed by a cost-of-living index of 86.9, which is below the national average. This lower cost of living enhances take-home purchasing power for local therapists, making their earnings go further. Among the various employers in Benton, outpatient clinics and rehabilitation hospitals often pay the most, particularly those that offer productivity incentives based on visits per day and board certification stipends. The disparity in pay is also shaped by variables such as practice model—cash-pay options tend to yield higher earnings compared to traditional insurance models. To maximize pay in Benton, therapists should consider obtaining board certifications like OCS or SCS, align their practice with high-demand employers, and remain agile in negotiation strategies to enhance their earning potential.
More salary data for Benton, AR:
Frequently Asked Questions
How much do physical therapists make in Benton, AR in 2026?
Is Benton, AR a good place to work as a physical therapist?
Can physical therapists make $100K in Benton?
What is the cost-of-living adjusted physical therapist salary in Benton?
How much does a physical therapist make per hour in Benton?
Related Pages
Compare Salaries
Career Resources
Nearby Cities in Arkansas
Written by Alex Morgan, DPT
Career Analyst
Alex Morgan has over 10 years of experience in physical therapy. They specialize in orthopedic rehabilitation. Alex works in a private practice setting.
Methodology & Data Source
Salary figures on this page are 2026 projections based on the Bureau of Labor Statistics Occupational Employment and Wage Statistics (OEWS) survey, May 2026 release. The BLS reported a median annual salary of $97,907 for physical therapistsin the Benton metropolitan area. A 2.46% compound annual growth rate (CAGR), calculated from 6-year national BLS wage trends, was applied to project current 2026 compensation. Percentile ranges (P10–P90) represent the full salary distribution across experience levels and practice settings in this market.
Data Sources & Methodology
Salary data for Benton is estimated from official BLS state-level occupational wage data (2025), adjusted for regional cost-of-living differences using BEA RPP (Regional Price Parities).
2026 figures are projected from 2025 BLS data using a compound annual growth rate (CAGR) of 2.46%, derived from historical BLS wage trends for physical therapists (SOC 29-1123).
Compiled and verified by Alex Morgan, DPT, a licensed physical therapist with 10+ years of clinical experience. · View source data at BLS.gov