Physical Therapist Salary in Arkansas: $103,139 (2026)
Quick Answer:Across Arkansas's 21 metropolitan areas, the average median physical therapist pay sits at $103,139/year heading into 2026 — a figure projected from 2025 BLS OEWS wage data for SOC 29-1123. Because Arkansas sits at BEA RPP 86.9 (13% below the U.S. baseline), that statewide median translates to roughly $118,687 in nationally-comparable purchasing power. Highest-paying metros: Rogers ($106,210), Springdale ($106,134), Texarkana ($104,697).
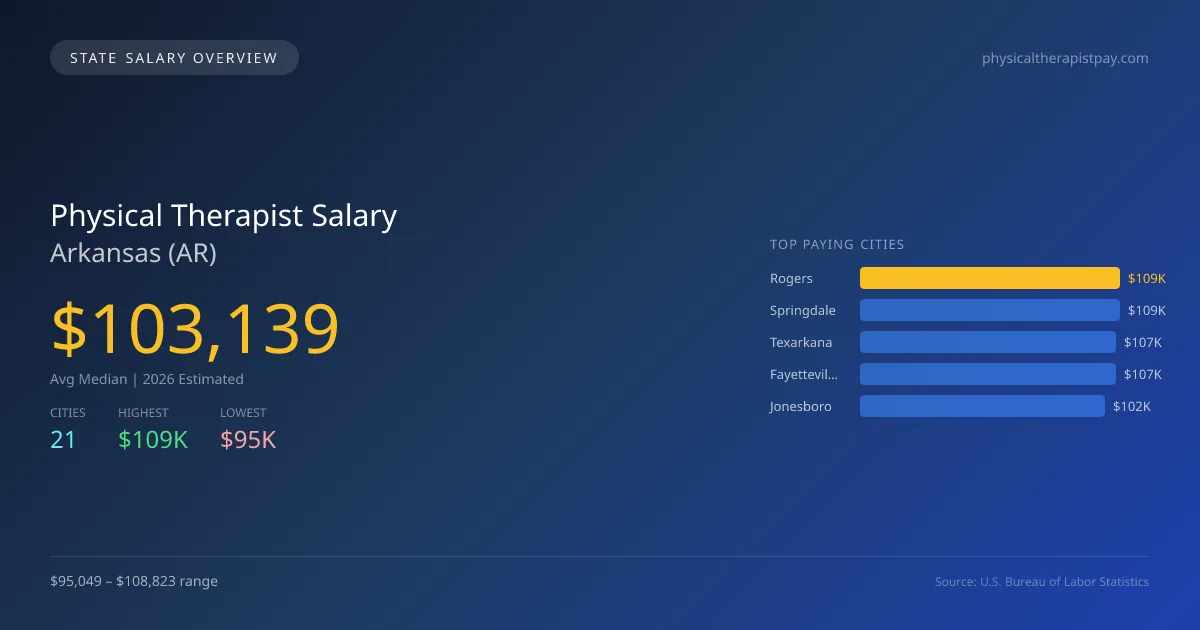
In 2026, physical therapists in Arkansas will see an average median salary of $103,138, which is slightly below the national median of $105,288, reflecting a 2.0% difference. The salary landscape varies significantly across the state, with Rogers offering the highest average at $108,823, while Van Buren provides the lowest at $95,049. This substantial gap of $13,774 can be driven by factors such as local demand for healthcare services, cost of living, and the presence of healthcare facilities. Arkansas has specific state licensing requirements and scope of practice laws that practitioners need to navigate. These regulations can impact salaries and job opportunities. The expected annual growth rate for physical therapy positions in Arkansas stands at 2.46%, indicating steady demand in the field. With a total of 2,041 employed physical therapists across 21 metro areas, cities like Springdale ($108,745), Texarkana ($107,273), Fayetteville ($107,071), and Jonesboro ($102,470) are also positioned well in terms of salary. Overall, while salaries in Arkansas may lag slightly behind national averages, the state offers stable job prospects for physical therapists, reflective of ongoing healthcare needs throughout the region.
Arkansas Physical Therapist Salary Range
Overall salary range in Arkansas: $71,919 (lowest entry-level) to $142,669 (highest top earner)
Arkansas vs National Average
Arkansas physical therapists earn 2.04% less than the national median ($-2,149/year difference).
Arkansas Physical Therapist Salary Distribution (2026)
Physical Therapist salaries in Arkansas range from $77,448 (entry-level, 10th percentile) to $129,686 (top earners, 90th percentile), with a median of $103,139. The Arkansas median is $2,149 below the US national median of $105,288. The average hourly rate is $49.59/hr. Approximately 2,041 physical therapists are employed across 21 cities.
2019 BLS Actual
$84,733
2025 BLS Actual
$100,662
2026 Current Est.
$103,139
2019–2027 Growth
+24.7%
Salary Trajectory for Physical Therapists in Arkansas (2019–2027)
2019–2025: actual BLS OEWS data for this metro area. 2026+: CAGR 2.46% projection.
| Year | Annual Salary | Status |
|---|---|---|
| 2019 | $84,733 | Actual |
| 2020 | $84,067 | Actual |
| 2021 | $82,290 | Actual |
| 2022 | $91,596 | Actual |
| 2023 | $93,163 | Actual |
| 2024 | $95,484 | Actual |
| 2025 | $100,662 | Actual |
| 2026(current) | $103,139 | Estimated |
| 2027 | $105,676 | Projected |
Based on 7 years of BLS OEWS data for the Arkansas metropolitan area, the median physical therapist salary grew 18.8% from $84,733 (2019) to $100,662 (2025). At a 2.46% compound annual growth rate, salaries are projected to reach $105,676 by 2027 — a total increase of $20,943 (24.72%) from 2019.
Note: Historical values (2019–2025) are actual BLS OEWS figures for the Arkansas metropolitan area, sourced from annual Occupational Employment and Wage Statistics surveys. 2026–2026 figures are current estimates, and 2027 values are projections, calculated using a 2.46% CAGR derived from 7-year BLS historical data. Actual salaries may vary based on employer, experience, certifications, and local market conditions.
Top 5 Highest Paying Cities in Arkansas
Lowest Paying Cities in Arkansas
| City | Median Salary |
|---|---|
| Van Buren | $95,049 |
| Bryant | $96,759 |
| Searcy | $97,491 |
| Cabot | $98,520 |
| Russellville | $98,965 |
Best Value Cities for Physical Therapists in Arkansas
When adjusted for local cost of living, these Arkansas cities offer the most purchasing power for physical therapists.
| City | Nominal Salary | CoL Index | Adjusted Salary |
|---|---|---|---|
| Rogers | $108,823 | 86.9 | $125,228 |
| Springdale | $108,745 | 86.9 | $125,138 |
| Texarkana | $107,273 | 86.9 | $123,444 |
| Jonesboro | $102,470 | 85.876 | $119,323 |
| Fort Smith | $101,159 | 85.888 | $117,780 |
Adjusted salary = nominal salary × (100 / CoL index). CoL index: 100 = national average. Lower index = lower cost of living.
Salary by Experience Level in Arkansas
| Experience Level | Estimated Annual |
|---|---|
| Entry Level (0-2 years) | $77,448 |
| Mid Career (3-7 years) | $103,139 |
| Experienced (7+ years) | $129,686 |
Estimates based on BLS percentile data averaged across Arkansas metro areas. Individual pay varies by employer, certifications, and specialization.
All 21 Cities in Arkansas
| # | City | Median Salary |
|---|---|---|
| 1 | Rogers | $108,823 |
| 2 | Springdale | $108,745 |
| 3 | Texarkana | $107,273 |
| 4 | Fayetteville | $107,071 |
| 5 | Jonesboro | $102,470 |
| 6 | Little Rock | $102,399 |
| 7 | Jacksonville | $101,659 |
| 8 | Bentonville | $101,160 |
| 9 | Fort Smith | $101,159 |
| 10 | North Little Rock | $100,887 |
| 11 | Benton | $100,316 |
| 12 | Conway | $100,223 |
| 13 | Paragould | $100,030 |
| 14 | Pine Bluff | $99,951 |
| 15 | Hot Springs | $99,653 |
| 16 | Sherwood | $99,490 |
| 17 | Russellville | $98,965 |
| 18 | Cabot | $98,520 |
| 19 | Searcy | $97,491 |
| 20 | Bryant | $96,759 |
| 21 | Van Buren | $95,049 |
More Arkansas Salary Data
Hourly Rates
Explore physical therapist hourly pay in Arkansas cities.
Senior / Experienced
Top earner salaries for experienced physical therapists.
Explore More Physical Therapist Salary Data
Frequently Asked Questions
How much do physical therapists make in Arkansas in 2026?
What is the highest paying city for physical therapists in Arkansas?
How does Arkansas physical therapist pay compare to the national average?
What is the entry-level physical therapist salary in Arkansas?
How many physical therapists are employed in Arkansas?
Which Arkansas city offers the best value for physical therapists?
Written by Alex Morgan, DPT
Career Analyst
Alex Morgan has over 10 years of experience in physical therapy. They specialize in orthopedic rehabilitation. Alex works in a private practice setting.
Methodology & Data Source
Statewide salary figures on this page are 2026 projections based on the Bureau of Labor Statistics Occupational Employment and Wage Statistics (OEWS) survey, May 2026 release. A 2.46% compound annual growth rate (CAGR), derived from 6-year national BLS wage trends, was applied to each metro area's reported salary to estimate current 2026 physical therapist compensation across Arkansas. State averages are employment-weighted across 21 metro areas — larger metro areas with more physical therapistscontribute proportionally more to the average, producing figures that better reflect typical compensation. Individual pay varies by city, employer, certifications, and experience.
Data Sources & Methodology
Source: BLS, OEWS, 7-year dataset (–). Per-city data from annual BLS metropolitan area surveys.
2026 figures are projected from 2025 BLS data using a compound annual growth rate (CAGR) of 2.46%, derived from historical BLS wage trends for physical therapists (SOC 29-1123).
Compiled and verified by Alex Morgan, DPT, a licensed physical therapist with 10+ years of clinical experience. · View source data at BLS.gov