Physical Therapist Salary in Fort Smith, AR: $101,159 (2026)
Quick Answer:A full-time physical therapist in Fort Smith, AR earns a median $101,159/year (≈ $48.64/hour) in nominal terms for 2026 — projected from BLS OEWS 2025 (SOC 29-1123). Once you factor in Fort Smith's price level (14% below national, BEA RPP 85.9), that paycheck buys what $117,780 would nationally. Nominal pay sits 1.2% below the Arkansas state average.
Official BLS data · View source
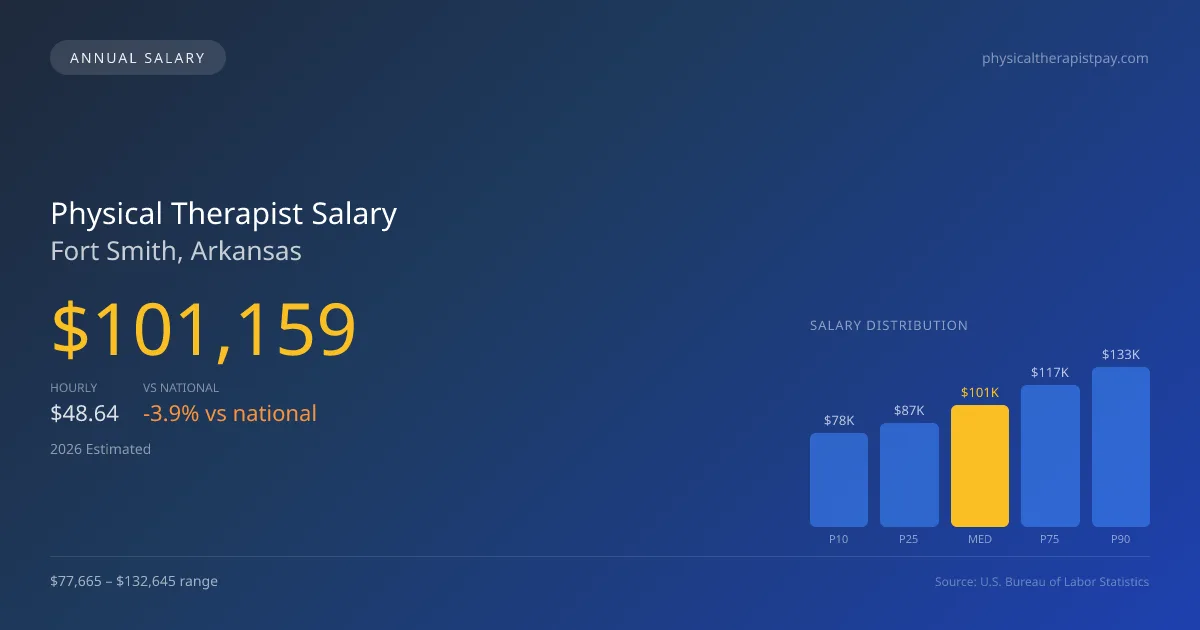
In 2026, the physical therapist salary in Fort Smith, Arkansas, is projected to reach a median annual figure of $101,159, which is slightly below the national average of $105,288. The range for salaries in this area extends from $77,665 at the 10th percentile to as high as $132,645 at the 90th percentile. This data, based on 2025 BLS OEWS data projected to 2026, underscores the influence of productivity expectations on compensation. As physical therapists are increasingly tasked with maintaining high visit counts per day, compensation can vary widely based on the efficiency and volume of services provided, reflecting the competitive nature of this field within Fort Smith.
Salary Breakdown
| Percentile | Annual | Hourly |
|---|---|---|
| Entry Level (P10) | $77,665 | $37.34 |
| Lower Range (P25) | $86,538 | $41.61 |
| Median (P50)(typical) | $101,159 | $48.64 |
| Upper Range (P75) | $117,358 | $56.42 |
| Top Earners (P90) | $132,645 | $63.77 |
Median Salary Position
3.92% below the national average
2026 Salary Percentile Distribution in Fort Smith
In Fort Smith, AR, the physical therapist salary spread from the 10th to 90th percentile is $54,980 (2026 est.). At $101,159, the local median is 3.92% below the national median of $105,288.
Salary Calculator
At 40 hours/week in Fort Smith: You'd be in the lower-middle range
How Fort Smith Physical Therapist Pay Compares
Fort Smith median: $101,159/year (2026)
| Compared To | Median Salary | Fort Smith Pays |
|---|---|---|
| Arkansas Average | $102,387 | -1.20% less |
| National Average | $105,288 | -3.92% less |
Physical Therapists in Fort Smith, AR earn a median of $101,159 per year (2026 est.), which is 3.92% lower than the national median of $105,288 and 1.20% below the Arkansas state average of $102,387.
Cost-of-Living Adjusted Salary
Fort Smith has a cost of living 14.11% below the national average, meaning your salary goes further here.
Adjusted salary = nominal × (100 / CoL index). CoL index: 100 = national average.
Fort Smith, AR has a cost-of-living index of 85.888 (below the national average of 100). A physical therapist earning $101,159 nominally has purchasing power equivalent to $117,780 in an average-cost city — an effective 16.43% boost.
Compare Purchasing Power
Select a city to see how your salary compares after cost of living
Select a city above to compare purchasing power
2019 BLS Actual
$95,050
2025 BLS Actual
$98,730
2026 Current Est.
$101,159
2019–2027 Growth
+9.0%
Salary Trajectory for Physical Therapists in Fort Smith (2019–2027)
2019–2025: actual BLS OEWS data for this metro area. 2026+: CAGR 2.46% projection.
| Year | Annual Salary | Status |
|---|---|---|
| 2019 | $95,050 | Actual |
| 2020 | $100,660 | Actual |
| 2021 | $76,810 | Actual |
| 2022 | $98,420 | Actual |
| 2023 | $90,130 | Actual |
| 2024 | $96,840 | Actual |
| 2025 | $98,730 | Actual |
| 2026(current) | $101,159 | Estimated |
| 2027 | $103,647 | Projected |
Based on 7 years of BLS OEWS data for the Fort Smith metropolitan area, the median physical therapist salary grew 3.9% from $95,050 (2019) to $98,730 (2025). At a 2.46% compound annual growth rate, salaries are projected to reach $103,647 by 2027 — a total increase of $8,597 (9.04%) from 2019.
Note: Historical values (2019–2025) are actual BLS OEWS figures for the Fort Smith metropolitan area, sourced from annual Occupational Employment and Wage Statistics surveys. 2026–2026 figures are current estimates, and 2027 values are projections, calculated using a 2.46% CAGR derived from 7-year BLS historical data. Actual salaries may vary based on employer, experience, certifications, and local market conditions.
Salary by Experience Level
| Experience | Estimated Salary Range |
|---|---|
| 0-2 years (New Graduate) | $77,665 – $86,538 |
| 3-5 years (Mid Career) | $86,538 – $101,159 |
| 5+ years (Experienced) | $101,159 – $117,358 |
| 10+ years (Top Earner) | $117,358 – $132,645 |
PT salary ranges estimated from BLS percentile data. Individual physical therapist compensation varies by employer, certifications, and specialization.
Physical Therapist Job Market in Fort Smith
With approximately 160 physical therapists currently employed in Fort Smith, the local job market remains robust amid a cost-of-living index of 85.888, which is below the national average. This lower cost of living can positively affect take-home pay, allowing therapists to stretch their salaries further. Employers such as outpatient orthopedic clinics, including chains like Athletico and ATI, often offer competitive pay but may tie compensation to stringent productivity metrics and bonuses. On the other hand, hospital systems might provide more stability, although they could also impose similar productivity demands. To maximize earning potential in this market, physical therapists may consider obtaining board certifications, such as OCS or SCS, which can command higher stipends. Additionally, pursuing opportunities in higher-paying sectors like skilled nursing facilities and sports medicine clinics, as well as considering cash-pay models versus insurance reimbursement, can also be strategic moves for increasing compensation in Fort Smith, AR.
More salary data for Fort Smith, AR:
Frequently Asked Questions
How much do physical therapists make in Fort Smith, AR in 2026?
Is Fort Smith, AR a good place to work as a physical therapist?
Can physical therapists make $100K in Fort Smith?
What is the cost-of-living adjusted physical therapist salary in Fort Smith?
How much does a physical therapist make per hour in Fort Smith?
Related Pages
Compare Salaries
Career Resources
Nearby Cities in Arkansas
Written by Alex Morgan, DPT
Career Analyst
Alex Morgan has over 10 years of experience in physical therapy. They specialize in orthopedic rehabilitation. Alex works in a private practice setting.
Methodology & Data Source
Salary figures on this page are 2026 projections based on the Bureau of Labor Statistics Occupational Employment and Wage Statistics (OEWS) survey, May 2026 release. The BLS reported a median annual salary of $98,730 for physical therapistsin the Fort Smith metropolitan area. A 2.46% compound annual growth rate (CAGR), calculated from 6-year national BLS wage trends, was applied to project current 2026 compensation. Percentile ranges (P10–P90) represent the full salary distribution across experience levels and practice settings in this market.
Data Sources & Methodology
Source: BLS, OEWS, 7-year dataset (–). Per-city data from annual BLS metropolitan area surveys.
2026 figures are projected from 2025 BLS data using a compound annual growth rate (CAGR) of 2.46%, derived from historical BLS wage trends for physical therapists (SOC 29-1123).
Compiled and verified by Alex Morgan, DPT, a licensed physical therapist with 10+ years of clinical experience. · View source data at BLS.gov