Physical Therapist Salary in Ferndale, MI: $98,828 (2026)
Quick Answer:A full-time physical therapist in Ferndale, MI earns a median $98,828/year (≈ $47.51/hour) in nominal terms for 2026 — projected from BLS OEWS 2025 (SOC 29-1123). Once you factor in Ferndale's price level (7% below national, BEA RPP 93.2), that paycheck buys what $106,039 would nationally. Nominal pay sits 5.1% below the Michigan state average.
Based on BLS state-level estimates · View source
In Ferndale, Michigan, the expected annual compensation for physical therapists in 2026 is projected at $98,828, which reflects a competitive, albeit slightly lower, pay scale compared to the national median of $105,288. The salary range extends from $76,710 at the 10th percentile to $120,290 at the 90th percentile, indicating a varied earning potential based on experience, specialization, and the type of facility. These figures are derived from 2025 BLS data projections adjusted for regional price levels, showcasing the unique employment environment in Ferndale. Options for therapists include outpatient clinics, hospital systems, and skilled nursing facilities, each presenting different pay structures influenced by service delivery models and patient throughput.
About the Ferndale Market
Salary estimated from Michigan average ($92,000) adjusted for local cost of living.
Salary Breakdown
| Percentile | Annual | Hourly |
|---|---|---|
| Entry Level (P10) | $76,710 | $36.88 |
| Lower Range (P25) | $83,094 | $39.95 |
| Median (P50)(typical) | $98,828 | $47.51 |
| Upper Range (P75) | $112,528 | $54.10 |
| Top Earners (P90) | $120,290 | $57.83 |
Median Salary Position
6.14% below the national average
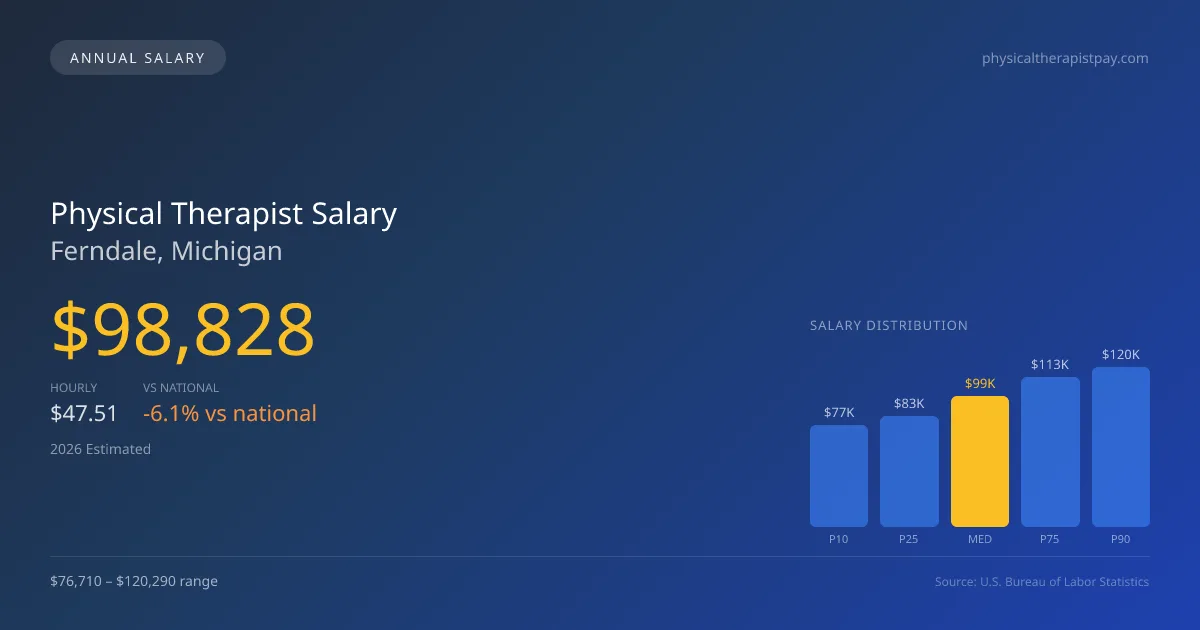
2026 Salary Percentile Distribution in Ferndale
In Ferndale, MI, the physical therapist salary spread from the 10th to 90th percentile is $43,580 (2026 est.). At $98,828, the local median is 6.14% below the national median of $105,288.
Salary Calculator
At 40 hours/week in Ferndale: You'd be above the median
How Ferndale Physical Therapist Pay Compares
Ferndale median: $98,828/year (2026)
| Compared To | Median Salary | Ferndale Pays |
|---|---|---|
| Michigan Average | $104,139 | -5.10% less |
| National Average | $105,288 | -6.14% less |
Physical Therapists in Ferndale, MI earn a median of $98,828 per year (2026 est.), which is 6.14% lower than the national median of $105,288 and 5.10% below the Michigan state average of $104,139.
Cost-of-Living Adjusted Salary
Ferndale has a cost of living 6.80% below the national average, meaning your salary goes further here.
Adjusted salary = nominal × (100 / CoL index). CoL index: 100 = national average.
Ferndale, MI has a cost-of-living index of 93.2 (below the national average of 100). A physical therapist earning $98,828 nominally has purchasing power equivalent to $106,039 in an average-cost city — an effective 7.3% boost.
Compare Purchasing Power
Select a city to see how your salary compares after cost of living
Select a city above to compare purchasing power
2019 BLS Actual
$83,952
2025 BLS Actual
$96,455
2026 Current Est.
$98,828
2019–2027 Growth
+20.6%
Salary Trajectory for Physical Therapists in Ferndale (2019–2027)
2019–2025: actual BLS OEWS data for this metro area. 2026+: CAGR 2.46% projection.
| Year | Annual Salary | Status |
|---|---|---|
| 2019 | $83,952 | Actual |
| 2020 | $85,426 | Actual |
| 2021 | $89,753 | Actual |
| 2022 | $91,724 | Actual |
| 2023 | $93,592 | Actual |
| 2024 | $81,370 | Actual |
| 2025 | $96,455 | Actual |
| 2026(current) | $98,828 | Estimated |
| 2027 | $101,259 | Projected |
Based on 7 years of BLS OEWS data for the Ferndale metropolitan area, the median physical therapist salary grew 14.9% from $83,952 (2019) to $96,455 (2025). At a 2.46% compound annual growth rate, salaries are projected to reach $101,259 by 2027 — a total increase of $17,307 (20.62%) from 2019.
Note: Historical values (2019–2025) are actual BLS OEWS figures for the Ferndale metropolitan area, sourced from annual Occupational Employment and Wage Statistics surveys. 2026–2026 figures are current estimates, and 2027 values are projections, calculated using a 2.46% CAGR derived from 7-year BLS historical data. Actual salaries may vary based on employer, experience, certifications, and local market conditions.
Salary by Experience Level
| Experience | Estimated Salary Range |
|---|---|
| 0-2 years (New Graduate) | $76,710 – $83,094 |
| 3-5 years (Mid Career) | $83,094 – $98,828 |
| 5+ years (Experienced) | $98,828 – $112,528 |
| 10+ years (Top Earner) | $112,528 – $120,290 |
PT salary ranges estimated from BLS percentile data. Individual physical therapist compensation varies by employer, certifications, and specialization.
Physical Therapist Job Market in Ferndale
The local job market for physical therapists in Ferndale is relatively modest, with only five professionals currently employed in the area. This limited pool suggests that competition for roles may be lower, but it also underlines the concentration of opportunities. Given Ferndale’s cost of living index of 93.2, physical therapists should consider how this impacts their overall purchasing power. Among the varied employment settings, outpatient orthopedic clinics and hospital inpatient rehab tend to offer the most competitive pay; however, those in specialized roles or with board certifications such as OCS or SCS may command additional stipends. Productivity benchmarks—determined by units per visit and overall case load—also contribute to the disparities in compensation. To enhance earning potential in this market, therapists might consider greater specialization, seeking employment at higher paying clinics, or engaging in cash-pay models that can offer more flexible rates and potentially higher returns.
More salary data for Ferndale, MI:
Frequently Asked Questions
How much do physical therapists make in Ferndale, MI in 2026?
Is Ferndale, MI a good place to work as a physical therapist?
Can physical therapists make $100K in Ferndale?
What is the cost-of-living adjusted physical therapist salary in Ferndale?
How much does a physical therapist make per hour in Ferndale?
Related Pages
Compare Salaries
Career Resources
Nearby Cities in Michigan
Written by Alex Morgan, DPT
Career Analyst
Alex Morgan has over 10 years of experience in physical therapy. They specialize in orthopedic rehabilitation. Alex works in a private practice setting.
Methodology & Data Source
Salary figures on this page are 2026 projections based on the Bureau of Labor Statistics Occupational Employment and Wage Statistics (OEWS) survey, May 2026 release. The BLS reported a median annual salary of $96,455 for physical therapistsin the Ferndale metropolitan area. A 2.46% compound annual growth rate (CAGR), calculated from 6-year national BLS wage trends, was applied to project current 2026 compensation. Percentile ranges (P10–P90) represent the full salary distribution across experience levels and practice settings in this market.
Data Sources & Methodology
Salary data for Ferndale is estimated from official BLS state-level occupational wage data (2025), adjusted for regional cost-of-living differences using BEA RPP (Regional Price Parities).
2026 figures are projected from 2025 BLS data using a compound annual growth rate (CAGR) of 2.46%, derived from historical BLS wage trends for physical therapists (SOC 29-1123).
Compiled and verified by Alex Morgan, DPT, a licensed physical therapist with 10+ years of clinical experience. · View source data at BLS.gov