Physical Therapist Salary in Kansas City, MO: $103,761 (2026)
Quick Answer:A full-time physical therapist in Kansas City, MO earns a median $103,761/year (≈ $49.89/hour) in nominal terms for 2026 — projected from BLS OEWS 2025 (SOC 29-1123). Once you factor in Kansas City's price level (7% below national, BEA RPP 92.5), that paycheck buys what $112,122 would nationally. Nominal pay sits 1.5% above the Missouri state average.
Official BLS data · View source
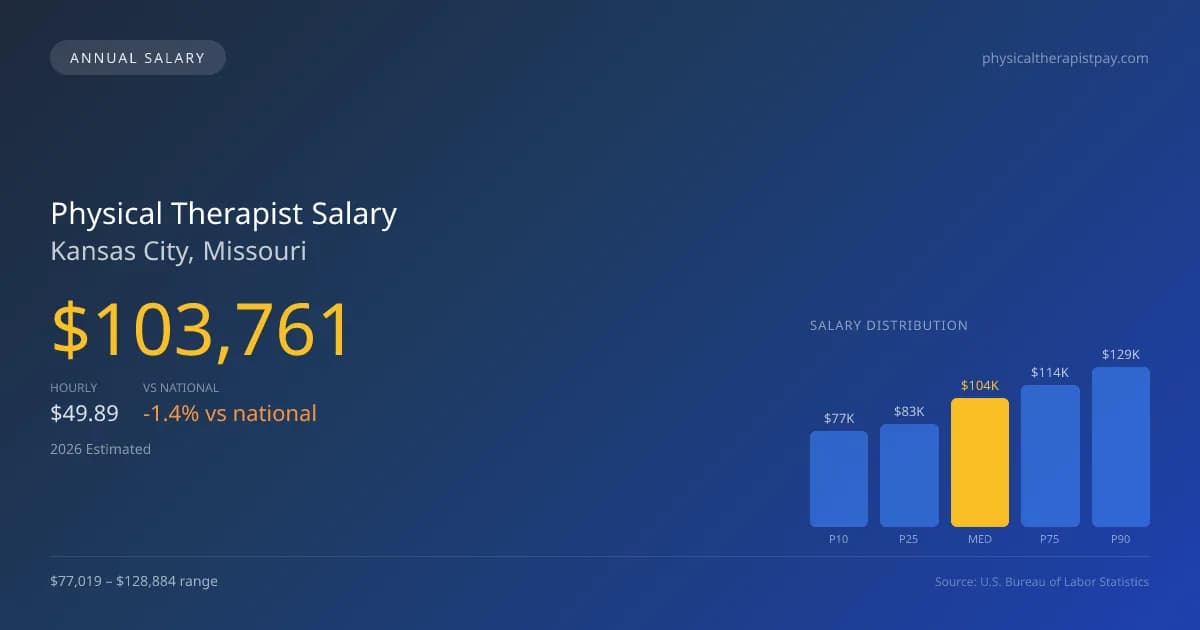
In 2026, the compensation for physical therapists in Kansas City, Missouri, is projected to reach a median annual salary of $103,761, which is slightly below the national median of $105,288. The salary range is notably diverse, spanning from $77,019 at the 10th percentile to $128,884 at the 90th percentile. These figures, drawn from 2025 Bureau of Labor Statistics (BLS) Occupational Employment and Wage Statistics data, reflect the varying productivity expectations within the industry. With the rising demand for physical therapy services, therapists increasingly face pressures related to visits-per-day productivity, which can greatly influence hourly earnings. This landscape creates a competitive job market in Kansas City, providing various opportunities for entry-level to experienced practitioners seeking to maximize their salary potential.
Salary Breakdown
| Percentile | Annual | Hourly |
|---|---|---|
| Entry Level (P10) | $77,019 | $37.03 |
| Lower Range (P25) | $83,003 | $39.91 |
| Median (P50)(typical) | $103,761 | $49.89 |
| Upper Range (P75) | $114,386 | $54.99 |
| Top Earners (P90) | $128,884 | $61.97 |
Median Salary Position
1.45% below the national average
2026 Salary Percentile Distribution in Kansas City
In Kansas City, MO, the physical therapist salary spread from the 10th to 90th percentile is $51,865 (2026 est.). At $103,761, the local median is 1.45% below the national median of $105,288.
Salary Calculator
At 40 hours/week in Kansas City: You'd be above the median
How Kansas City Physical Therapist Pay Compares
Kansas City median: $103,761/year (2026)
| Compared To | Median Salary | Kansas City Pays |
|---|---|---|
| Missouri Average | $102,228 | +1.50% more |
| National Average | $105,288 | -1.45% less |
Physical Therapists in Kansas City, MO earn a median of $103,761 per year (2026 est.), which is 1.45% lower than the national median of $105,288 and 1.50% above the Missouri state average of $102,228.
Cost-of-Living Adjusted Salary
Kansas City has a cost of living 7.46% below the national average, meaning your salary goes further here.
Adjusted salary = nominal × (100 / CoL index). CoL index: 100 = national average.
Kansas City, MO has a cost-of-living index of 92.543 (below the national average of 100). A physical therapist earning $103,761 nominally has purchasing power equivalent to $112,122 in an average-cost city — an effective 8.06% boost.
Compare Purchasing Power
Select a city to see how your salary compares after cost of living
Select a city above to compare purchasing power
2019 BLS Actual
$84,640
2025 BLS Actual
$101,270
2026 Current Est.
$103,761
2019–2027 Growth
+25.6%
Salary Trajectory for Physical Therapists in Kansas City (2019–2027)
2019–2025: actual BLS OEWS data for this metro area. 2026+: CAGR 2.46% projection.
| Year | Annual Salary | Status |
|---|---|---|
| 2019 | $84,640 | Actual |
| 2020 | $90,560 | Actual |
| 2021 | $85,230 | Actual |
| 2022 | $97,190 | Actual |
| 2023 | $95,920 | Actual |
| 2024 | $99,330 | Actual |
| 2025 | $101,270 | Actual |
| 2026(current) | $103,761 | Estimated |
| 2027 | $106,314 | Projected |
Based on 7 years of BLS OEWS data for the Kansas City metropolitan area, the median physical therapist salary grew 19.6% from $84,640 (2019) to $101,270 (2025). At a 2.46% compound annual growth rate, salaries are projected to reach $106,314 by 2027 — a total increase of $21,674 (25.61%) from 2019.
Note: Historical values (2019–2025) are actual BLS OEWS figures for the Kansas City metropolitan area, sourced from annual Occupational Employment and Wage Statistics surveys. 2026–2026 figures are current estimates, and 2027 values are projections, calculated using a 2.46% CAGR derived from 7-year BLS historical data. Actual salaries may vary based on employer, experience, certifications, and local market conditions.
Salary by Experience Level
| Experience | Estimated Salary Range |
|---|---|
| 0-2 years (New Graduate) | $77,019 – $83,003 |
| 3-5 years (Mid Career) | $83,003 – $103,761 |
| 5+ years (Experienced) | $103,761 – $114,386 |
| 10+ years (Top Earner) | $114,386 – $128,884 |
PT salary ranges estimated from BLS percentile data. Individual physical therapist compensation varies by employer, certifications, and specialization.
Physical Therapist Job Market in Kansas City
The local job market supports around 2,010 physical therapists, presenting a favorable environment for career growth. With a cost-of-living index of 92.543, Kansas City provides a more affordable living compared to the national average, enhancing the take-home purchasing power for practitioners. Employers in the region that typically offer higher wages include outpatient orthopedic clinics, skilled nursing facilities, and some hospital systems, often favoring those with specialized board certifications like OCS or SCS. The diversity in payment largely stems from factors such as productivity metrics, employer models—whether cash-pay or insurance-based—and the potential for bonuses. To maximize earnings in this market, professionals should focus on enhancing their certifications, understanding reimbursement structures, and exploring opportunities with employers who provide substantial productivity incentives.
More salary data for Kansas City, MO:
Frequently Asked Questions
How much do physical therapists make in Kansas City, MO in 2026?
Is Kansas City, MO a good place to work as a physical therapist?
Can physical therapists make $100K in Kansas City?
What is the cost-of-living adjusted physical therapist salary in Kansas City?
How much does a physical therapist make per hour in Kansas City?
Related Pages
Compare Salaries
Career Resources
Nearby Cities in Missouri
Written by Alex Morgan, DPT
Career Analyst
Alex Morgan has over 10 years of experience in physical therapy. They specialize in orthopedic rehabilitation. Alex works in a private practice setting.
Methodology & Data Source
Salary figures on this page are 2026 projections based on the Bureau of Labor Statistics Occupational Employment and Wage Statistics (OEWS) survey, May 2026 release. The BLS reported a median annual salary of $101,270 for physical therapistsin the Kansas City metropolitan area. A 2.46% compound annual growth rate (CAGR), calculated from 6-year national BLS wage trends, was applied to project current 2026 compensation. Percentile ranges (P10–P90) represent the full salary distribution across experience levels and practice settings in this market.
Data Sources & Methodology
Source: BLS, OEWS, 7-year dataset (–). Per-city data from annual BLS metropolitan area surveys.
2026 figures are projected from 2025 BLS data using a compound annual growth rate (CAGR) of 2.46%, derived from historical BLS wage trends for physical therapists (SOC 29-1123).
Compiled and verified by Alex Morgan, DPT, a licensed physical therapist with 10+ years of clinical experience. · View source data at BLS.gov