Physical Therapist Salary in St. Louis, MO: $103,075 (2026)
Quick Answer:A full-time physical therapist in St. Louis, MO earns a median $103,075/year (≈ $49.56/hour) in nominal terms for 2026 — projected from BLS OEWS 2025 (SOC 29-1123). Once you factor in St. Louis's price level (5% below national, BEA RPP 95.1), that paycheck buys what $108,400 would nationally. Nominal pay sits 0.9% above the Missouri state average.
Official BLS data · View source
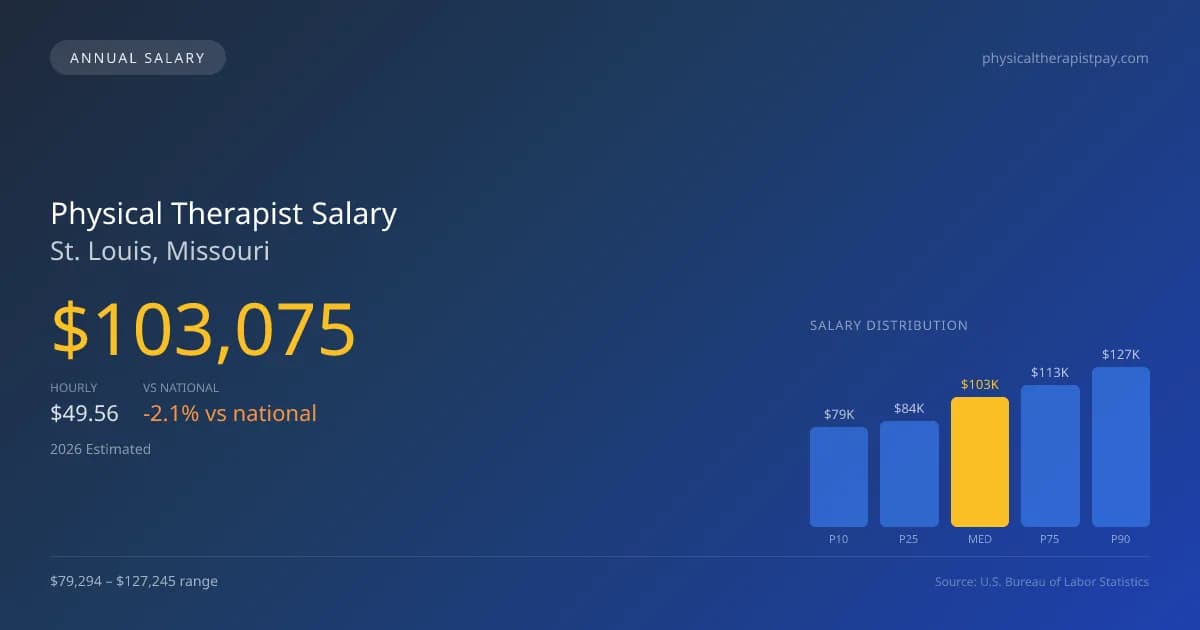
In 2026, the average physical therapist salary in St. Louis is projected at $103,075, reflecting an economy that values effective patient care amidst productivity expectations. The salary range for physical therapists in this city varies significantly from a low of $79,294 to a high of $127,245, highlighting the differences in experience, specialization, and practice settings. These figures are derived from official Bureau of Labor Statistics (BLS) Occupational Employment and Wage Statistics (OEWS) data, illustrating how local factors influence earnings. Compared to the national median for physical therapists, which sits at $105,288, St. Louis's compensation trends slightly below that figure, suggesting competitive yet challenging market conditions for practitioners seeking to maximize their earnings within the city's healthcare framework.
Salary Breakdown
| Percentile | Annual | Hourly |
|---|---|---|
| Entry Level (P10) | $79,294 | $38.13 |
| Lower Range (P25) | $83,925 | $40.35 |
| Median (P50)(typical) | $103,075 | $49.56 |
| Upper Range (P75) | $113,229 | $54.44 |
| Top Earners (P90) | $127,245 | $61.18 |
Median Salary Position
2.1% below the national average
2026 Salary Percentile Distribution in St. Louis
In St. Louis, MO, the physical therapist salary spread from the 10th to 90th percentile is $47,951 (2026 est.). At $103,075, the local median is 2.1% below the national median of $105,288.
Salary Calculator
At 40 hours/week in St. Louis: You'd be above the median
How St. Louis Physical Therapist Pay Compares
St. Louis median: $103,075/year (2026)
| Compared To | Median Salary | St. Louis Pays |
|---|---|---|
| Missouri Average | $102,155 | +0.90% more |
| National Average | $105,288 | -2.10% less |
Physical Therapists in St. Louis, MO earn a median of $103,075 per year (2026 est.), which is 2.10% lower than the national median of $105,288 and 0.90% above the Missouri state average of $102,155.
Cost-of-Living Adjusted Salary
St. Louis has a cost of living 4.91% below the national average, meaning your salary goes further here.
Adjusted salary = nominal × (100 / CoL index). CoL index: 100 = national average.
St. Louis, MO has a cost-of-living index of 95.088 (below the national average of 100). A physical therapist earning $103,075 nominally has purchasing power equivalent to $108,400 in an average-cost city — an effective 5.17% boost.
Compare Purchasing Power
Select a city to see how your salary compares after cost of living
Select a city above to compare purchasing power
2019 BLS Actual
$82,730
2025 BLS Actual
$100,600
2026 Current Est.
$103,075
2019–2027 Growth
+27.7%
Salary Trajectory for Physical Therapists in St. Louis (2019–2027)
2019–2025: actual BLS OEWS data for this metro area. 2026+: CAGR 2.46% projection.
| Year | Annual Salary | Status |
|---|---|---|
| 2019 | $82,730 | Actual |
| 2020 | $84,360 | Actual |
| 2021 | $79,330 | Actual |
| 2022 | $96,270 | Actual |
| 2023 | $97,200 | Actual |
| 2024 | $96,770 | Actual |
| 2025 | $100,600 | Actual |
| 2026(current) | $103,075 | Estimated |
| 2027 | $105,610 | Projected |
Based on 7 years of BLS OEWS data for the St. Louis metropolitan area, the median physical therapist salary grew 21.6% from $82,730 (2019) to $100,600 (2025). At a 2.46% compound annual growth rate, salaries are projected to reach $105,610 by 2027 — a total increase of $22,880 (27.66%) from 2019.
Note: Historical values (2019–2025) are actual BLS OEWS figures for the St. Louis metropolitan area, sourced from annual Occupational Employment and Wage Statistics surveys. 2026–2026 figures are current estimates, and 2027 values are projections, calculated using a 2.46% CAGR derived from 7-year BLS historical data. Actual salaries may vary based on employer, experience, certifications, and local market conditions.
Salary by Experience Level
| Experience | Estimated Salary Range |
|---|---|
| 0-2 years (New Graduate) | $79,294 – $83,925 |
| 3-5 years (Mid Career) | $83,925 – $103,075 |
| 5+ years (Experienced) | $103,075 – $113,229 |
| 10+ years (Top Earner) | $113,229 – $127,245 |
PT salary ranges estimated from BLS percentile data. Individual physical therapist compensation varies by employer, certifications, and specialization.
Physical Therapist Job Market in St. Louis
With approximately 2,480 physical therapists employed in the St. Louis area, the job market remains robust. The cost of living index stands at a favorable 95.088, indicating that take-home pay may stretch further here than in many other metropolitan regions. Among the various employers, outpatient orthopedic clinics, particularly chains like ATI and Athletico, typically offer competitive compensation, although hospital systems may augment their paychecks with benefits and stability amidst changing reimbursement rates. The disparity in physical therapist pay in St. Louis often stems from productivity pressures, with those held to higher visit quotas earning more, as well as the added benefits of advanced board certifications (OCS, SCS) which can come with stipends. To optimize earnings, practitioners should focus on enhancing patient volume, exploring cash-pay models, and considering travel opportunities that offer premium compensation, especially as the field grapples with evolving reimbursement structures.
More salary data for St. Louis, MO:
Frequently Asked Questions
How much do physical therapists make in St. Louis, MO in 2026?
Is St. Louis, MO a good place to work as a physical therapist?
Can physical therapists make $100K in St. Louis?
What is the cost-of-living adjusted physical therapist salary in St. Louis?
How much does a physical therapist make per hour in St. Louis?
Related Pages
Compare Salaries
Career Resources
Nearby Cities in Missouri
Written by Alex Morgan, DPT
Career Analyst
Alex Morgan has over 10 years of experience in physical therapy. They specialize in orthopedic rehabilitation. Alex works in a private practice setting.
Methodology & Data Source
Salary figures on this page are 2026 projections based on the Bureau of Labor Statistics Occupational Employment and Wage Statistics (OEWS) survey, May 2026 release. The BLS reported a median annual salary of $100,600 for physical therapistsin the St. Louis metropolitan area. A 2.46% compound annual growth rate (CAGR), calculated from 6-year national BLS wage trends, was applied to project current 2026 compensation. Percentile ranges (P10–P90) represent the full salary distribution across experience levels and practice settings in this market.
Data Sources & Methodology
Source: BLS, OEWS, 7-year dataset (–). Per-city data from annual BLS metropolitan area surveys.
2026 figures are projected from 2025 BLS data using a compound annual growth rate (CAGR) of 2.46%, derived from historical BLS wage trends for physical therapists (SOC 29-1123).
Compiled and verified by Alex Morgan, DPT, a licensed physical therapist with 10+ years of clinical experience. · View source data at BLS.gov