Physical Therapist Salary in Billings, MT: $99,407 (2026)
Quick Answer:A full-time physical therapist in Billings, MT earns a median $99,407/year (≈ $47.79/hour) in nominal terms for 2026 — projected from BLS OEWS 2025 (SOC 29-1123). Once you factor in Billings's price level (6% below national, BEA RPP 93.5), that paycheck buys what $106,288 would nationally. Nominal pay sits 15.0% above the Montana state average.
Official BLS data · View source
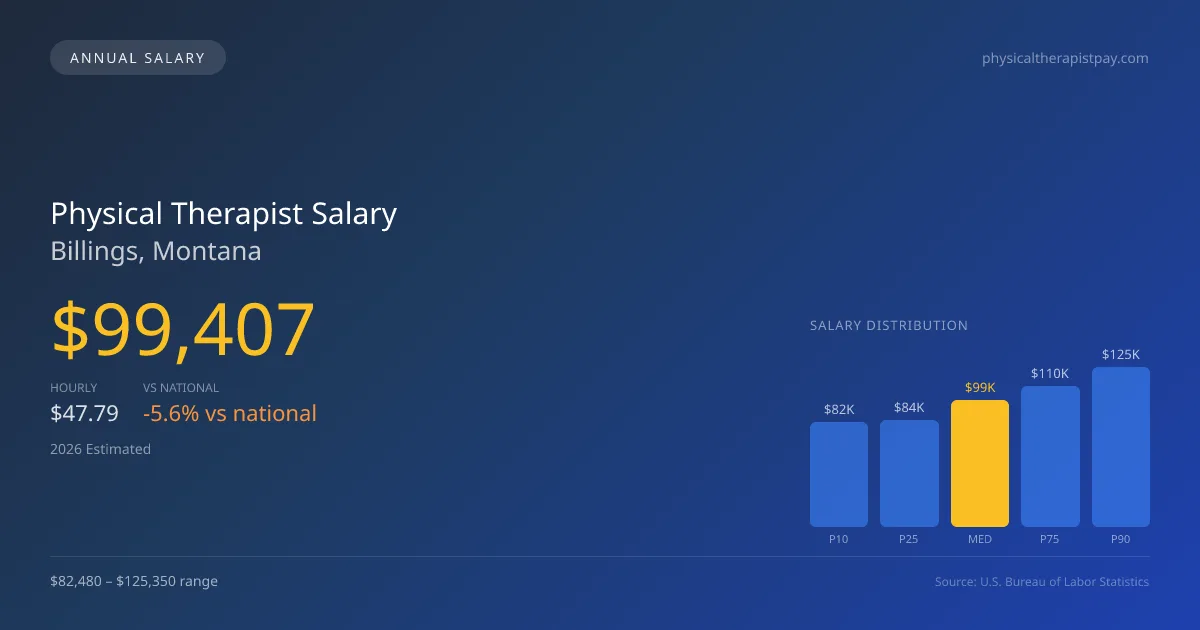
In Billings, MT, physical therapists command a median annual salary of $99,407, slightly trailing the national median of $105,288 by about 5.59%. With a salary range spanning from $82,480 at the 10th percentile to $125,350 at the 90th percentile, there’s considerable potential for growth within the field. These figures are derived from official Bureau of Labor Statistics (BLS) Occupational Employment and Wage Statistics (OEWS) surveys, reflecting an evolving healthcare landscape influenced by the rise of cash-pay models, especially in sports and orthopedic specialties. This trend tends to elevate the compensation for therapists willing to engage in practices reliant on direct patient payments. Overall, the physical therapist job market in Billings displays robust opportunities for professionals eager to optimize their earnings.
Salary Breakdown
| Percentile | Annual | Hourly |
|---|---|---|
| Entry Level (P10) | $82,480 | $39.65 |
| Lower Range (P25) | $84,079 | $40.42 |
| Median (P50)(typical) | $99,407 | $47.79 |
| Upper Range (P75) | $110,349 | $53.05 |
| Top Earners (P90) | $125,350 | $60.27 |
Median Salary Position
5.59% below the national average
2026 Salary Percentile Distribution in Billings
In Billings, MT, the physical therapist salary spread from the 10th to 90th percentile is $42,870 (2026 est.). At $99,407, the local median is 5.59% below the national median of $105,288.
Salary Calculator
At 40 hours/week in Billings: You'd be in the lower-middle range
How Billings Physical Therapist Pay Compares
Billings median: $99,407/year (2026)
| Compared To | Median Salary | Billings Pays |
|---|---|---|
| Montana Average | $86,441 | +15.00% more |
| National Average | $105,288 | -5.59% less |
Physical Therapists in Billings, MT earn a median of $99,407 per year (2026 est.), which is 5.59% lower than the national median of $105,288 and 15.00% above the Montana state average of $86,441.
Cost-of-Living Adjusted Salary
Billings has a cost of living 6.47% below the national average, meaning your salary goes further here.
Adjusted salary = nominal × (100 / CoL index). CoL index: 100 = national average.
Billings, MT has a cost-of-living index of 93.526 (below the national average of 100). A physical therapist earning $99,407 nominally has purchasing power equivalent to $106,288 in an average-cost city — an effective 6.92% boost.
Compare Purchasing Power
Select a city to see how your salary compares after cost of living
Select a city above to compare purchasing power
2019 BLS Actual
$86,930
2025 BLS Actual
$97,020
2026 Current Est.
$99,407
2019–2027 Growth
+17.2%
Salary Trajectory for Physical Therapists in Billings (2019–2027)
2019–2025: actual BLS OEWS data for this metro area. 2026+: CAGR 2.46% projection.
| Year | Annual Salary | Status |
|---|---|---|
| 2019 | $86,930 | Actual |
| 2020 | $91,010 | Actual |
| 2021 | $82,080 | Actual |
| 2022 | $88,410 | Actual |
| 2023 | $92,470 | Actual |
| 2024 | $99,750 | Actual |
| 2025 | $97,020 | Actual |
| 2026(current) | $99,407 | Estimated |
| 2027 | $101,852 | Projected |
Based on 7 years of BLS OEWS data for the Billings metropolitan area, the median physical therapist salary grew 11.6% from $86,930 (2019) to $97,020 (2025). At a 2.46% compound annual growth rate, salaries are projected to reach $101,852 by 2027 — a total increase of $14,922 (17.17%) from 2019.
Note: Historical values (2019–2025) are actual BLS OEWS figures for the Billings metropolitan area, sourced from annual Occupational Employment and Wage Statistics surveys. 2026–2026 figures are current estimates, and 2027 values are projections, calculated using a 2.46% CAGR derived from 7-year BLS historical data. Actual salaries may vary based on employer, experience, certifications, and local market conditions.
Salary by Experience Level
| Experience | Estimated Salary Range |
|---|---|
| 0-2 years (New Graduate) | $82,480 – $84,079 |
| 3-5 years (Mid Career) | $84,079 – $99,407 |
| 5+ years (Experienced) | $99,407 – $110,349 |
| 10+ years (Top Earner) | $110,349 – $125,350 |
PT salary ranges estimated from BLS percentile data. Individual physical therapist compensation varies by employer, certifications, and specialization.
Physical Therapist Job Market in Billings
The local employment scene includes approximately 230 physical therapists currently practicing in Billings. The cost-of-living index stands at 93.526, which means that while salaries may seem lower compared to national averages, the purchasing power for residents is relatively higher thanks to lower overall living expenses. Outpatient orthopedic clinics, including chains like Athletico, often offer competitive pay structures, but salaries can also vary significantly between different settings, such as hospital inpatient rehabilitation or home health agencies. The disparity in earnings can stem from multiple factors, including productivity expectations—where therapists are often required to meet specific metrics per patient visit—as well as the impact of specialization. For those looking to boost their earning potential in Billings, pursuing board certifications like OCS or SCS can provide a significant pay increase, while therapists considering private practice may find financial benefits through cash-pay models.
More salary data for Billings, MT:
Frequently Asked Questions
How much do physical therapists make in Billings, MT in 2026?
Is Billings, MT a good place to work as a physical therapist?
Can physical therapists make $100K in Billings?
What is the cost-of-living adjusted physical therapist salary in Billings?
How much does a physical therapist make per hour in Billings?
Related Pages
Compare Salaries
Career Resources
Nearby Cities in Montana
Written by Alex Morgan, DPT
Career Analyst
Alex Morgan has over 10 years of experience in physical therapy. They specialize in orthopedic rehabilitation. Alex works in a private practice setting.
Methodology & Data Source
Salary figures on this page are 2026 projections based on the Bureau of Labor Statistics Occupational Employment and Wage Statistics (OEWS) survey, May 2026 release. The BLS reported a median annual salary of $97,020 for physical therapistsin the Billings metropolitan area. A 2.46% compound annual growth rate (CAGR), calculated from 6-year national BLS wage trends, was applied to project current 2026 compensation. Percentile ranges (P10–P90) represent the full salary distribution across experience levels and practice settings in this market.
Data Sources & Methodology
Source: BLS, OEWS, 7-year dataset (–). Per-city data from annual BLS metropolitan area surveys.
2026 figures are projected from 2025 BLS data using a compound annual growth rate (CAGR) of 2.46%, derived from historical BLS wage trends for physical therapists (SOC 29-1123).
Compiled and verified by Alex Morgan, DPT, a licensed physical therapist with 10+ years of clinical experience. · View source data at BLS.gov