Physical Therapist Salary in Bozeman, MT: $99,796 (2026)
Quick Answer:A full-time physical therapist in Bozeman, MT earns a median $99,796/year (≈ $47.98/hour) in nominal terms for 2026 — projected from BLS OEWS 2025 (SOC 29-1123). Once you factor in Bozeman's price level (3% above national, BEA RPP 102.5), that paycheck buys what $97,352 would nationally. Nominal pay sits 15.4% above the Montana state average.
Official BLS data · View source
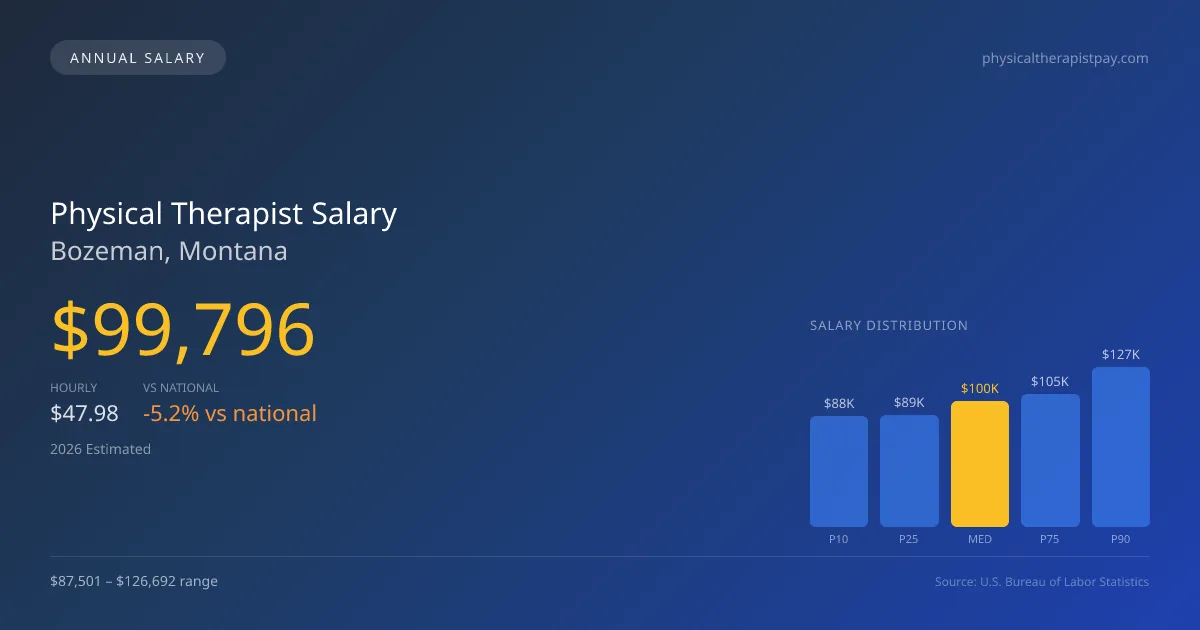
In 2026, physical therapist salaries in Bozeman, Montana, are expected to reflect the local healthcare employment dynamics, with a projected median annual salary of $99,796. This amount places physical therapists in Bozeman within a range from $87,501 at the 10th percentile to $126,692 at the 90th percentile, indicative of variability in pay based on workplace settings. The source of this data is derived from BLS OEWS surveys, which suggest that outpatient clinics, often operated by chains like ATI and Athletico, may generally offer lower salaries than hospital systems. However, these facilities may provide incentives through productivity bonuses that can enhance total compensation. Given the emphasis on productivity and efficiency within outpatient settings, it’s clear that the job market for physical therapists in Bozeman is significantly influenced by these structural choices.
Salary Breakdown
| Percentile | Annual | Hourly |
|---|---|---|
| Entry Level (P10) | $87,501 | $42.07 |
| Lower Range (P25) | $89,079 | $42.83 |
| Median (P50)(typical) | $99,796 | $47.98 |
| Upper Range (P75) | $105,062 | $50.51 |
| Top Earners (P90) | $126,692 | $60.91 |
Median Salary Position
5.22% below the national average
2026 Salary Percentile Distribution in Bozeman
In Bozeman, MT, the physical therapist salary spread from the 10th to 90th percentile is $39,191 (2026 est.). At $99,796, the local median is 5.22% below the national median of $105,288.
Salary Calculator
At 40 hours/week in Bozeman: You'd be in the lower-middle range
How Bozeman Physical Therapist Pay Compares
Bozeman median: $99,796/year (2026)
| Compared To | Median Salary | Bozeman Pays |
|---|---|---|
| Montana Average | $86,478 | +15.40% more |
| National Average | $105,288 | -5.22% less |
Physical Therapists in Bozeman, MT earn a median of $99,796 per year (2026 est.), which is 5.22% lower than the national median of $105,288 and 15.40% above the Montana state average of $86,478.
Cost-of-Living Adjusted Salary
Bozeman has a cost of living 2.51% above the national average.
Adjusted salary = nominal × (100 / CoL index). CoL index: 100 = national average.
Bozeman, MT has a cost-of-living index of 102.51 (above the national average of 100). While the nominal salary of $99,796 is competitive, the higher cost of living reduces purchasing power to an effective $97,352 — a 2.45% reduction.
Compare Purchasing Power
Select a city to see how your salary compares after cost of living
Select a city above to compare purchasing power
2019 BLS Actual
$84,775
2025 BLS Actual
$97,400
2026 Current Est.
$99,796
2019–2027 Growth
+20.6%
Salary Trajectory for Physical Therapists in Bozeman (2019–2027)
2019–2025: actual BLS OEWS data for this metro area. 2026+: CAGR 2.46% projection.
| Year | Annual Salary | Status |
|---|---|---|
| 2019 | $84,775 | Actual |
| 2020 | $86,263 | Actual |
| 2021 | $90,632 | Actual |
| 2022 | $92,623 | Actual |
| 2023 | $94,509 | Actual |
| 2024 | $96,220 | Actual |
| 2025 | $97,400 | Actual |
| 2026(current) | $99,796 | Estimated |
| 2027 | $102,251 | Projected |
Based on 7 years of BLS OEWS data for the Bozeman metropolitan area, the median physical therapist salary grew 14.9% from $84,775 (2019) to $97,400 (2025). At a 2.46% compound annual growth rate, salaries are projected to reach $102,251 by 2027 — a total increase of $17,476 (20.61%) from 2019.
Note: Historical values (2019–2025) are actual BLS OEWS figures for the Bozeman metropolitan area, sourced from annual Occupational Employment and Wage Statistics surveys. 2026–2026 figures are current estimates, and 2027 values are projections, calculated using a 2.46% CAGR derived from 7-year BLS historical data. Actual salaries may vary based on employer, experience, certifications, and local market conditions.
Salary by Experience Level
| Experience | Estimated Salary Range |
|---|---|
| 0-2 years (New Graduate) | $87,501 – $89,079 |
| 3-5 years (Mid Career) | $89,079 – $99,796 |
| 5+ years (Experienced) | $99,796 – $105,062 |
| 10+ years (Top Earner) | $105,062 – $126,692 |
PT salary ranges estimated from BLS percentile data. Individual physical therapist compensation varies by employer, certifications, and specialization.
Physical Therapist Job Market in Bozeman
The Bozeman job market hosts approximately 150 physical therapists, reflecting a steady demand for skilled professionals in the field. With a cost-of-living index of 102.51, the purchasing power of salaries may not stretch as far as it would in lower-cost areas, impacting take-home pay. Among the local employers, outpatient orthopedic clinics typically dominate the landscape, but hospital inpatient rehabilitation centers often present higher salary offers along with opportunities for specialization and board certification, such as OCS or SCS. The variations in physical therapist pay in Bozeman, MT, stem from factors such as expected productivity, practice models (cash-pay vs. insurance), and potential equity stakes in clinic ownership. To maximize earnings, aspiring physical therapists should consider diversifying their skill sets, pursuing specialized certifications, and exploring opportunities in high-demand sectors like sports medicine and pediatric therapy.
More salary data for Bozeman, MT:
Frequently Asked Questions
How much do physical therapists make in Bozeman, MT in 2026?
Is Bozeman, MT a good place to work as a physical therapist?
Can physical therapists make $100K in Bozeman?
What is the cost-of-living adjusted physical therapist salary in Bozeman?
How much does a physical therapist make per hour in Bozeman?
Related Pages
Compare Salaries
Career Resources
Nearby Cities in Montana
Written by Alex Morgan, DPT
Career Analyst
Alex Morgan has over 10 years of experience in physical therapy. They specialize in orthopedic rehabilitation. Alex works in a private practice setting.
Methodology & Data Source
Salary figures on this page are 2026 projections based on the Bureau of Labor Statistics Occupational Employment and Wage Statistics (OEWS) survey, May 2026 release. The BLS reported a median annual salary of $97,400 for physical therapistsin the Bozeman metropolitan area. A 2.46% compound annual growth rate (CAGR), calculated from 6-year national BLS wage trends, was applied to project current 2026 compensation. Percentile ranges (P10–P90) represent the full salary distribution across experience levels and practice settings in this market.
Data Sources & Methodology
Source: BLS, OEWS, 2-year dataset (–). Per-city data from annual BLS metropolitan area surveys.
2026 figures are projected from 2025 BLS data using a compound annual growth rate (CAGR) of 2.46%, derived from historical BLS wage trends for physical therapists (SOC 29-1123).
Compiled and verified by Alex Morgan, DPT, a licensed physical therapist with 10+ years of clinical experience. · View source data at BLS.gov