Physical Therapist Salary in New Mexico: $109,583 (2026)
Quick Answer:Across New Mexico's 17 metropolitan areas, the average median physical therapist pay sits at $109,583/year heading into 2026 — a figure projected from 2025 BLS OEWS wage data for SOC 29-1123. Because New Mexico sits at BEA RPP 94.4 (6% below the U.S. baseline), that statewide median translates to roughly $116,084 in nationally-comparable purchasing power. Highest-paying metros: Santa Fe ($124,870), Las Cruces ($120,350), Albuquerque ($103,510).
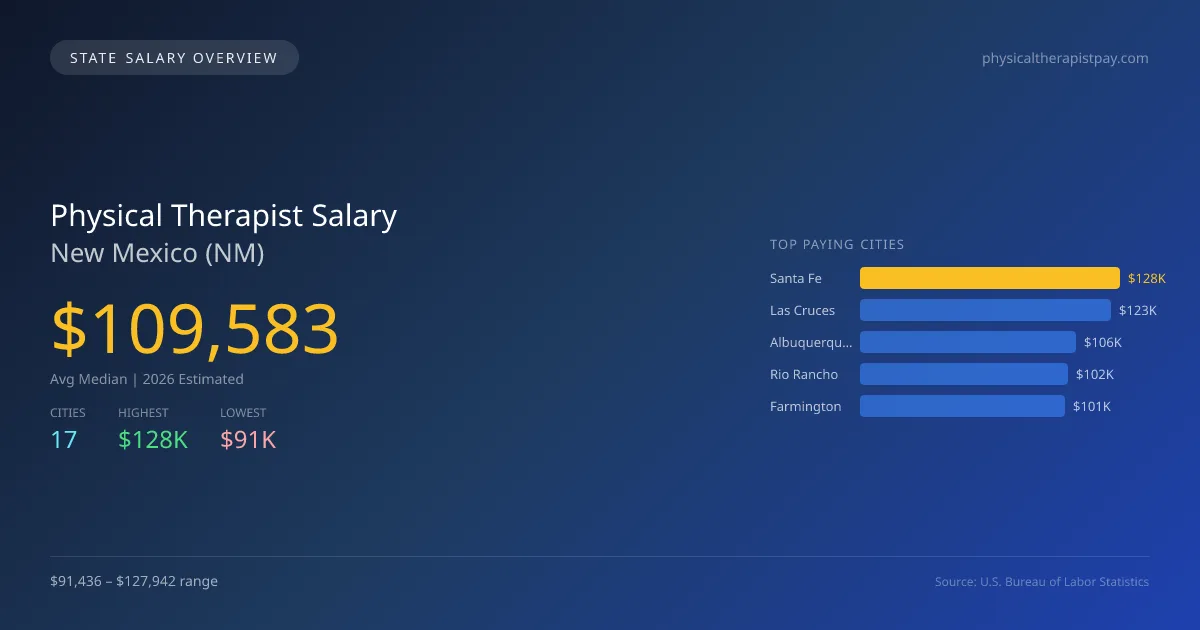
In 2026, physical therapist salaries in New Mexico are projected to average $109,583, slightly above the national median of $105,288, reflecting a 4.1% premium over national figures. The salary range within the state varies significantly, with the highest-paying city, Santa Fe, offering $127,942, while Taos has the lowest average salary at $91,436. This disparity is influenced by factors such as the cost of living, local demand for healthcare services, and the concentration of healthcare facilities in urban areas. New Mexico's physical therapy landscape is shaped by specific state regulations, including licensing requirements and scope of practice laws that ensure practitioners meet professional standards. The demand for physical therapists is driven by an aging population and an increasing emphasis on rehabilitation services, contributing to a projected annual growth rate of 2.46% in the job market. Cities like Las Cruces and Albuquerque also reflect strong employment opportunities, with salaries of $123,311 and $106,056, respectively. As job demand continues to rise and the number of physical therapists remains steady at 1,122, professionals in New Mexico can anticipate a stable career trajectory in this field.
New Mexico Physical Therapist Salary Range
Overall salary range in New Mexico: $68,863 (lowest entry-level) to $167,573 (highest top earner)
New Mexico vs National Average
New Mexico physical therapists earn 4.08% more than the national median (+$4,295/year difference).
New Mexico Physical Therapist Salary Distribution (2026)
Physical Therapist salaries in New Mexico range from $79,883 (entry-level, 10th percentile) to $143,818 (top earners, 90th percentile), with a median of $109,583. The New Mexico median is $4,295 above the US national median of $105,288. The average hourly rate is $52.68/hr. Approximately 1,122 physical therapists are employed across 17 cities.
2019 BLS Actual
$87,467
2025 BLS Actual
$106,952
2026 Current Est.
$109,583
2019–2027 Growth
+28.4%
Salary Trajectory for Physical Therapists in New Mexico (2019–2027)
2019–2025: actual BLS OEWS data for this metro area. 2026+: CAGR 2.46% projection.
| Year | Annual Salary | Status |
|---|---|---|
| 2019 | $87,467 | Actual |
| 2020 | $89,575 | Actual |
| 2021 | $97,852 | Actual |
| 2022 | $92,548 | Actual |
| 2023 | $97,699 | Actual |
| 2024 | $97,907 | Actual |
| 2025 | $106,952 | Actual |
| 2026(current) | $109,583 | Estimated |
| 2027 | $112,279 | Projected |
Based on 7 years of BLS OEWS data for the New Mexico metropolitan area, the median physical therapist salary grew 22.3% from $87,467 (2019) to $106,952 (2025). At a 2.46% compound annual growth rate, salaries are projected to reach $112,279 by 2027 — a total increase of $24,812 (28.37%) from 2019.
Note: Historical values (2019–2025) are actual BLS OEWS figures for the New Mexico metropolitan area, sourced from annual Occupational Employment and Wage Statistics surveys. 2026–2026 figures are current estimates, and 2027 values are projections, calculated using a 2.46% CAGR derived from 7-year BLS historical data. Actual salaries may vary based on employer, experience, certifications, and local market conditions.
Top 5 Highest Paying Cities in New Mexico
Lowest Paying Cities in New Mexico
| City | Median Salary |
|---|---|
| Taos | $91,436 |
| Los Alamos | $91,607 |
| Los Lunas | $92,378 |
| Las Vegas | $92,392 |
| Gallup | $92,408 |
Best Value Cities for Physical Therapists in New Mexico
When adjusted for local cost of living, these New Mexico cities offer the most purchasing power for physical therapists.
| City | Nominal Salary | CoL Index | Adjusted Salary |
|---|---|---|---|
| Las Cruces | $123,311 | 90.212 | $136,690 |
| Santa Fe | $127,942 | 98.767 | $129,539 |
| Farmington | $100,677 | 87.707 | $114,788 |
| Albuquerque | $106,056 | 95.546 | $111,000 |
| Rio Rancho | $102,300 | 94.4 | $108,369 |
Adjusted salary = nominal salary × (100 / CoL index). CoL index: 100 = national average. Lower index = lower cost of living.
Salary by Experience Level in New Mexico
| Experience Level | Estimated Annual |
|---|---|
| Entry Level (0-2 years) | $79,883 |
| Mid Career (3-7 years) | $109,583 |
| Experienced (7+ years) | $143,818 |
Estimates based on BLS percentile data averaged across New Mexico metro areas. Individual pay varies by employer, certifications, and specialization.
All 17 Cities in New Mexico
| # | City | Median Salary |
|---|---|---|
| 1 | Santa Fe | $127,942 |
| 2 | Las Cruces | $123,311 |
| 3 | Albuquerque | $106,056 |
| 4 | Rio Rancho | $102,300 |
| 5 | Farmington | $100,677 |
| 6 | Roswell | $97,501 |
| 7 | Alamogordo | $96,699 |
| 8 | Hobbs | $96,644 |
| 9 | South Valley | $96,252 |
| 10 | Clovis | $94,385 |
| 11 | Carlsbad | $94,239 |
| 12 | Deming | $92,737 |
| 13 | Gallup | $92,408 |
| 14 | Las Vegas | $92,392 |
| 15 | Los Lunas | $92,378 |
| 16 | Los Alamos | $91,607 |
| 17 | Taos | $91,436 |
More New Mexico Salary Data
Hourly Rates
Explore physical therapist hourly pay in New Mexico cities.
Senior / Experienced
Top earner salaries for experienced physical therapists.
Explore More Physical Therapist Salary Data
Frequently Asked Questions
How much do physical therapists make in New Mexico in 2026?
What is the highest paying city for physical therapists in New Mexico?
How does New Mexico physical therapist pay compare to the national average?
What is the entry-level physical therapist salary in New Mexico?
How many physical therapists are employed in New Mexico?
Which New Mexico city offers the best value for physical therapists?
Written by Alex Morgan, DPT
Career Analyst
Alex Morgan has over 10 years of experience in physical therapy. They specialize in orthopedic rehabilitation. Alex works in a private practice setting.
Methodology & Data Source
Statewide salary figures on this page are 2026 projections based on the Bureau of Labor Statistics Occupational Employment and Wage Statistics (OEWS) survey, May 2026 release. A 2.46% compound annual growth rate (CAGR), derived from 6-year national BLS wage trends, was applied to each metro area's reported salary to estimate current 2026 physical therapist compensation across New Mexico. State averages are employment-weighted across 17 metro areas — larger metro areas with more physical therapistscontribute proportionally more to the average, producing figures that better reflect typical compensation. Individual pay varies by city, employer, certifications, and experience.
Data Sources & Methodology
Source: BLS, OEWS, 7-year dataset (–). Per-city data from annual BLS metropolitan area surveys.
2026 figures are projected from 2025 BLS data using a compound annual growth rate (CAGR) of 2.46%, derived from historical BLS wage trends for physical therapists (SOC 29-1123).
Compiled and verified by Alex Morgan, DPT, a licensed physical therapist with 10+ years of clinical experience. · View source data at BLS.gov