Physical Therapist Salary in Farmington, NM: $100,677 (2026)
Quick Answer:A full-time physical therapist in Farmington, NM earns a median $100,677/year (≈ $48.40/hour) in nominal terms for 2026 — projected from BLS OEWS 2025 (SOC 29-1123). Once you factor in Farmington's price level (12% below national, BEA RPP 87.7), that paycheck buys what $114,788 would nationally. Nominal pay sits 1.3% above the New Mexico state average.
Official BLS data · View source
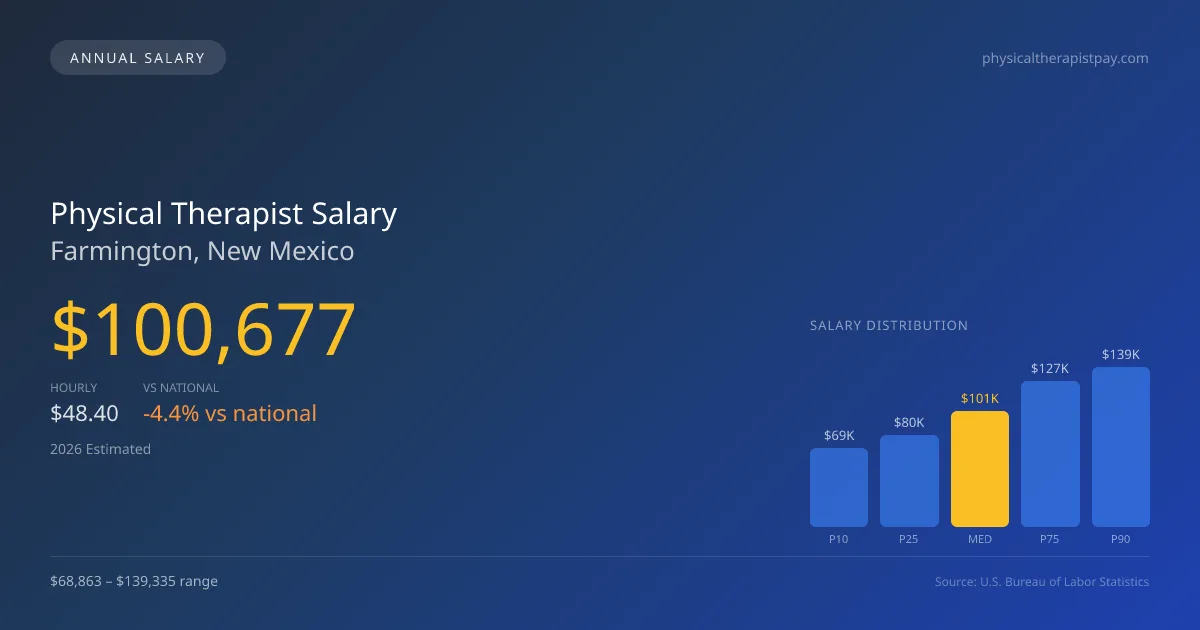
The projected median annual salary for physical therapists in Farmington, New Mexico, is $100,677, which reflects a slight decrease compared to the national average of $105,288. The salary range varies widely, spanning from $68,863 at the 10th percentile to $139,335 at the 90th percentile. This data is sourced from the Bureau of Labor Statistics (BLS) and reflects emerging trends in the local job market. In Farmington, the choice of practice setting can significantly impact compensation; outpatient facilities may offer different salaries than hospitals or skilled nursing facilities. As the demand for physical therapy services grows, understanding these nuances can help professionals make informed choices.
Salary Breakdown
| Percentile | Annual | Hourly |
|---|---|---|
| Entry Level (P10) | $68,863 | $33.10 |
| Lower Range (P25) | $79,704 | $38.32 |
| Median (P50)(typical) | $100,677 | $48.40 |
| Upper Range (P75) | $127,225 | $61.17 |
| Top Earners (P90) | $139,335 | $66.99 |
Median Salary Position
4.38% below the national average
2026 Salary Percentile Distribution in Farmington
In Farmington, NM, the physical therapist salary spread from the 10th to 90th percentile is $70,472 (2026 est.). At $100,677, the local median is 4.38% below the national median of $105,288.
Salary Calculator
At 40 hours/week in Farmington: You'd be in the lower-middle range
How Farmington Physical Therapist Pay Compares
Farmington median: $100,677/year (2026)
| Compared To | Median Salary | Farmington Pays |
|---|---|---|
| New Mexico Average | $99,385 | +1.30% more |
| National Average | $105,288 | -4.38% less |
Physical Therapists in Farmington, NM earn a median of $100,677 per year (2026 est.), which is 4.38% lower than the national median of $105,288 and 1.30% above the New Mexico state average of $99,385.
Cost-of-Living Adjusted Salary
Farmington has a cost of living 12.29% below the national average, meaning your salary goes further here.
Adjusted salary = nominal × (100 / CoL index). CoL index: 100 = national average.
Farmington, NM has a cost-of-living index of 87.707 (below the national average of 100). A physical therapist earning $100,677 nominally has purchasing power equivalent to $114,788 in an average-cost city — an effective 14.02% boost.
Compare Purchasing Power
Select a city to see how your salary compares after cost of living
Select a city above to compare purchasing power
2019 BLS Actual
$87,990
2025 BLS Actual
$98,260
2026 Current Est.
$100,677
2019–2027 Growth
+17.2%
Salary Trajectory for Physical Therapists in Farmington (2019–2027)
2019–2025: actual BLS OEWS data for this metro area. 2026+: CAGR 2.46% projection.
| Year | Annual Salary | Status |
|---|---|---|
| 2019 | $87,990 | Actual |
| 2020 | $87,570 | Actual |
| 2021 | $98,230 | Actual |
| 2022 | $100,030 | Actual |
| 2023 | $106,030 | Actual |
| 2024 | $105,510 | Actual |
| 2025 | $98,260 | Actual |
| 2026(current) | $100,677 | Estimated |
| 2027 | $103,154 | Projected |
Based on 7 years of BLS OEWS data for the Farmington metropolitan area, the median physical therapist salary grew 11.7% from $87,990 (2019) to $98,260 (2025). At a 2.46% compound annual growth rate, salaries are projected to reach $103,154 by 2027 — a total increase of $15,164 (17.23%) from 2019.
Note: Historical values (2019–2025) are actual BLS OEWS figures for the Farmington metropolitan area, sourced from annual Occupational Employment and Wage Statistics surveys. 2026–2026 figures are current estimates, and 2027 values are projections, calculated using a 2.46% CAGR derived from 7-year BLS historical data. Actual salaries may vary based on employer, experience, certifications, and local market conditions.
Salary by Experience Level
| Experience | Estimated Salary Range |
|---|---|
| 0-2 years (New Graduate) | $68,863 – $79,704 |
| 3-5 years (Mid Career) | $79,704 – $100,677 |
| 5+ years (Experienced) | $100,677 – $127,225 |
| 10+ years (Top Earner) | $127,225 – $139,335 |
PT salary ranges estimated from BLS percentile data. Individual physical therapist compensation varies by employer, certifications, and specialization.
Physical Therapist Job Market in Farmington
Analyzing the job market in Farmington reveals that about 60 physical therapists are currently employed in the area. With a cost of living index of 87.707, salaries in Farmington often stretch further than in places with higher living costs, enhancing take-home pay. Among local employers, outpatient orthopedic clinics, including chains like ATI and Athletico, often lead in compensation due to their capacity for productivity bonuses. Factors such as board certifications, productivity models, and practice ownership can create significant pay disparities. To maximize earning potential in this market, therapists should consider pursuing additional credentials, such as the Orthopedic Clinical Specialist (OCS) certification, while also identifying opportunities in cash-pay settings that circumvent insurance reimbursement challenges. This strategic approach can help physical therapists bolster their roles in a competitive landscape.
More salary data for Farmington, NM:
Frequently Asked Questions
How much do physical therapists make in Farmington, NM in 2026?
Is Farmington, NM a good place to work as a physical therapist?
Can physical therapists make $100K in Farmington?
What is the cost-of-living adjusted physical therapist salary in Farmington?
How much does a physical therapist make per hour in Farmington?
Related Pages
Compare Salaries
Career Resources
Nearby Cities in New Mexico
Written by Alex Morgan, DPT
Career Analyst
Alex Morgan has over 10 years of experience in physical therapy. They specialize in orthopedic rehabilitation. Alex works in a private practice setting.
Methodology & Data Source
Salary figures on this page are 2026 projections based on the Bureau of Labor Statistics Occupational Employment and Wage Statistics (OEWS) survey, May 2026 release. The BLS reported a median annual salary of $98,260 for physical therapistsin the Farmington metropolitan area. A 2.46% compound annual growth rate (CAGR), calculated from 6-year national BLS wage trends, was applied to project current 2026 compensation. Percentile ranges (P10–P90) represent the full salary distribution across experience levels and practice settings in this market.
Data Sources & Methodology
Source: BLS, OEWS, 7-year dataset (–). Per-city data from annual BLS metropolitan area surveys.
2026 figures are projected from 2025 BLS data using a compound annual growth rate (CAGR) of 2.46%, derived from historical BLS wage trends for physical therapists (SOC 29-1123).
Compiled and verified by Alex Morgan, DPT, a licensed physical therapist with 10+ years of clinical experience. · View source data at BLS.gov