Physical Therapist Salary in Goldsboro, NC: $91,405 (2026)
Quick Answer:A full-time physical therapist in Goldsboro, NC earns a median $91,405/year (≈ $43.95/hour) in nominal terms for 2026 — projected from BLS OEWS 2025 (SOC 29-1123). Once you factor in Goldsboro's price level (12% below national, BEA RPP 88.5), that paycheck buys what $103,327 would nationally. Nominal pay sits 10.7% below the North Carolina state average.
Official BLS data · View source
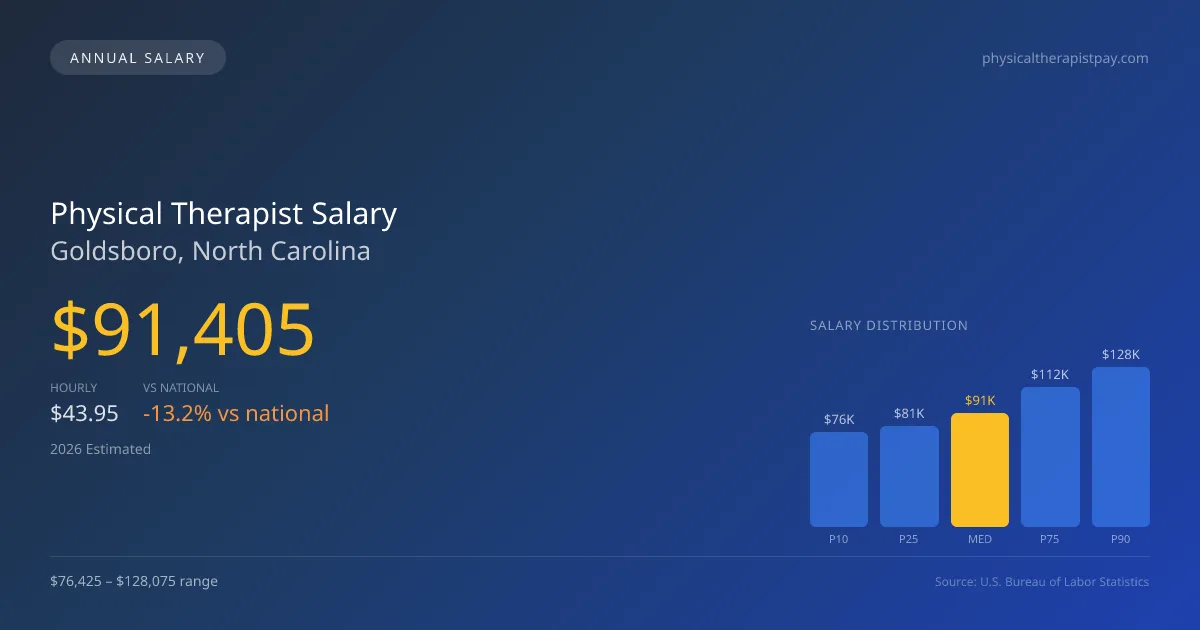
In Goldsboro, North Carolina, the physical therapist salary landscape is shaped by a range of factors that influence compensation levels. In 2026, the median annual pay for physical therapists is projected to be $91,405. This figure falls within a salary range that spans from $76,425 at the 10th percentile to $128,075 at the 90th percentile. These insights, derived from the official Bureau of Labor Statistics (BLS) OEWS data, highlight a notable trend in the local job market, particularly as cash-pay models are becoming increasingly prominent. This shift could supplement the earnings of those who specialize in orthopedic or sports therapy, creating a competitive edge in the higher salary brackets for physical therapists in Goldsboro.
Salary Breakdown
| Percentile | Annual | Hourly |
|---|---|---|
| Entry Level (P10) | $76,425 | $36.74 |
| Lower Range (P25) | $81,230 | $39.06 |
| Median (P50)(typical) | $91,405 | $43.95 |
| Upper Range (P75) | $112,358 | $54.02 |
| Top Earners (P90) | $128,075 | $61.58 |
Median Salary Position
13.19% below the national average
2026 Salary Percentile Distribution in Goldsboro
In Goldsboro, NC, the physical therapist salary spread from the 10th to 90th percentile is $51,650 (2026 est.). At $91,405, the local median is 13.19% below the national median of $105,288.
Salary Calculator
At 40 hours/week in Goldsboro: You'd be in the lower-middle range
How Goldsboro Physical Therapist Pay Compares
Goldsboro median: $91,405/year (2026)
| Compared To | Median Salary | Goldsboro Pays |
|---|---|---|
| North Carolina Average | $102,357 | -10.70% less |
| National Average | $105,288 | -13.19% less |
Physical Therapists in Goldsboro, NC earn a median of $91,405 per year (2026 est.), which is 13.19% lower than the national median of $105,288 and 10.70% below the North Carolina state average of $102,357.
Cost-of-Living Adjusted Salary
Goldsboro has a cost of living 11.54% below the national average, meaning your salary goes further here.
Adjusted salary = nominal × (100 / CoL index). CoL index: 100 = national average.
Goldsboro, NC has a cost-of-living index of 88.462 (below the national average of 100). A physical therapist earning $91,405 nominally has purchasing power equivalent to $103,327 in an average-cost city — an effective 13.04% boost.
Compare Purchasing Power
Select a city to see how your salary compares after cost of living
Select a city above to compare purchasing power
2019 BLS Actual
$80,960
2025 BLS Actual
$89,210
2026 Current Est.
$91,405
2019–2027 Growth
+15.7%
Salary Trajectory for Physical Therapists in Goldsboro (2019–2027)
2019–2025: actual BLS OEWS data for this metro area. 2026+: CAGR 2.46% projection.
| Year | Annual Salary | Status |
|---|---|---|
| 2019 | $80,960 | Actual |
| 2020 | $80,000 | Actual |
| 2021 | $77,310 | Actual |
| 2022 | $81,650 | Actual |
| 2023 | $88,850 | Actual |
| 2024 | $96,880 | Actual |
| 2025 | $89,210 | Actual |
| 2026(current) | $91,405 | Estimated |
| 2027 | $93,653 | Projected |
Based on 7 years of BLS OEWS data for the Goldsboro metropolitan area, the median physical therapist salary grew 10.2% from $80,960 (2019) to $89,210 (2025). At a 2.46% compound annual growth rate, salaries are projected to reach $93,653 by 2027 — a total increase of $12,693 (15.68%) from 2019.
Note: Historical values (2019–2025) are actual BLS OEWS figures for the Goldsboro metropolitan area, sourced from annual Occupational Employment and Wage Statistics surveys. 2026–2026 figures are current estimates, and 2027 values are projections, calculated using a 2.46% CAGR derived from 7-year BLS historical data. Actual salaries may vary based on employer, experience, certifications, and local market conditions.
Salary by Experience Level
| Experience | Estimated Salary Range |
|---|---|
| 0-2 years (New Graduate) | $76,425 – $81,230 |
| 3-5 years (Mid Career) | $81,230 – $91,405 |
| 5+ years (Experienced) | $91,405 – $112,358 |
| 10+ years (Top Earner) | $112,358 – $128,075 |
PT salary ranges estimated from BLS percentile data. Individual physical therapist compensation varies by employer, certifications, and specialization.
Physical Therapist Job Market in Goldsboro
The local job market in Goldsboro features about 50 physical therapists, fostering a dynamic professional environment. With a cost-of-living index of 88.462, which is below the national average, the real purchasing power of a physical therapist's salary can offer some advantages. Employers such as outpatient orthopedic clinics and hospital rehabilitation services typically pay higher wages compared to skilled nursing facilities and home health agencies. Factors contributing to the salary variations include productivity expectations, the inclusion of stipends for advanced board certifications, and the appeal of cash-pay practice models. To maximize earning potential in Goldsboro, physical therapists should consider pursuing specialized certifications like OCS or SCS, engaging in productivity-driven environments, or exploring opportunities within travel PT agencies that often offer higher compensation packages. By being strategic in their career moves, physical therapists can enhance their pay and professional opportunities in this evolving market.
More salary data for Goldsboro, NC:
Frequently Asked Questions
How much do physical therapists make in Goldsboro, NC in 2026?
Is Goldsboro, NC a good place to work as a physical therapist?
Can physical therapists make $100K in Goldsboro?
What is the cost-of-living adjusted physical therapist salary in Goldsboro?
How much does a physical therapist make per hour in Goldsboro?
Related Pages
Compare Salaries
Career Resources
Nearby Cities in North Carolina
Written by Alex Morgan, DPT
Career Analyst
Alex Morgan has over 10 years of experience in physical therapy. They specialize in orthopedic rehabilitation. Alex works in a private practice setting.
Methodology & Data Source
Salary figures on this page are 2026 projections based on the Bureau of Labor Statistics Occupational Employment and Wage Statistics (OEWS) survey, May 2026 release. The BLS reported a median annual salary of $89,210 for physical therapistsin the Goldsboro metropolitan area. A 2.46% compound annual growth rate (CAGR), calculated from 6-year national BLS wage trends, was applied to project current 2026 compensation. Percentile ranges (P10–P90) represent the full salary distribution across experience levels and practice settings in this market.
Data Sources & Methodology
Source: BLS, OEWS, 7-year dataset (–). Per-city data from annual BLS metropolitan area surveys.
2026 figures are projected from 2025 BLS data using a compound annual growth rate (CAGR) of 2.46%, derived from historical BLS wage trends for physical therapists (SOC 29-1123).
Compiled and verified by Alex Morgan, DPT, a licensed physical therapist with 10+ years of clinical experience. · View source data at BLS.gov