Physical Therapist Salary in Fargo, ND: $87,429 (2026)
Quick Answer:A full-time physical therapist in Fargo, ND earns a median $87,429/year (≈ $42.03/hour) in nominal terms for 2026 — projected from BLS OEWS 2025 (SOC 29-1123). Once you factor in Fargo's price level (9% below national, BEA RPP 90.9), that paycheck buys what $96,212 would nationally. Nominal pay sits 9.7% below the North Dakota state average.
Official BLS data · View source
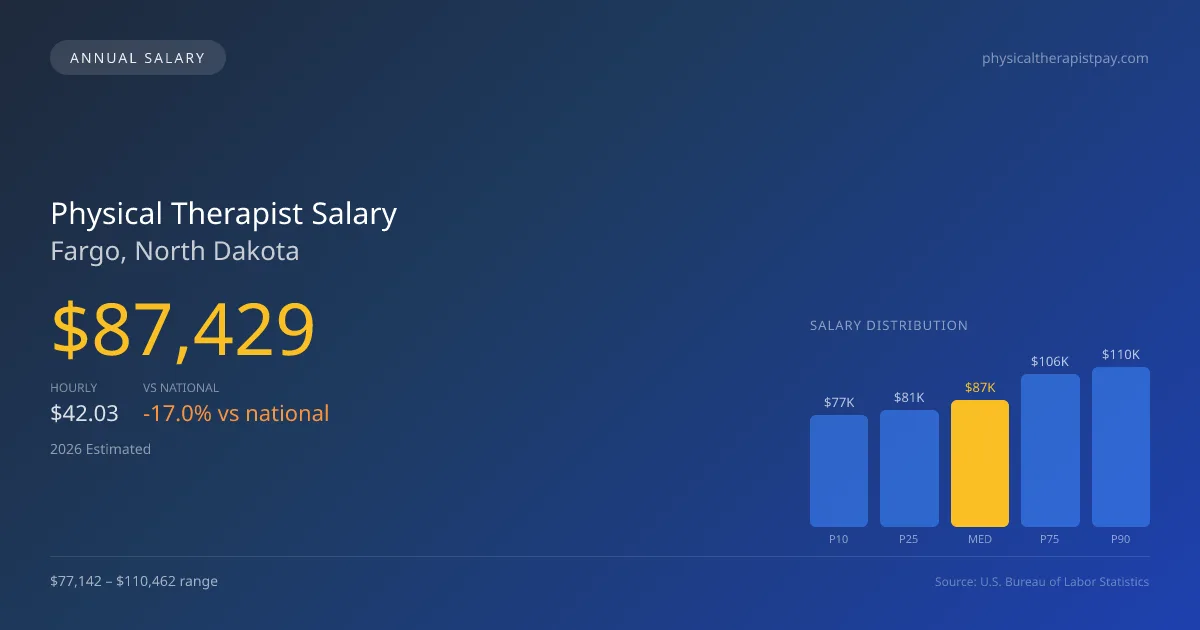
With a projected 2026 median annual salary of $87,429, physical therapist salaries in Fargo, ND are slightly below the national median of $105,288, reflecting a compensation trend that is 16.96% lower. The salary range for these professionals varies significantly, from $77,142 at the 10th percentile to $110,462 at the 90th percentile, indicating a diverse market influenced by experience, specialization, and practice setting. According to estimates based on 2025 BLS OEWS data, the local job market comprises approximately 350 employed physical therapists, a number that highlights both the competition and the opportunities available for new graduates entering the field. The productivity expectations tied to the volume of patient visits often dictate effective hourly compensation, making the choice of practice setting crucial for maximizing financial outcomes.
Salary Breakdown
| Percentile | Annual | Hourly |
|---|---|---|
| Entry Level (P10) | $77,142 | $37.09 |
| Lower Range (P25) | $81,025 | $38.96 |
| Median (P50)(typical) | $87,429 | $42.03 |
| Upper Range (P75) | $105,657 | $50.80 |
| Top Earners (P90) | $110,462 | $53.11 |
Median Salary Position
16.96% below the national average
2026 Salary Percentile Distribution in Fargo
In Fargo, ND, the physical therapist salary spread from the 10th to 90th percentile is $33,320 (2026 est.). At $87,429, the local median is 16.96% below the national median of $105,288.
Salary Calculator
At 40 hours/week in Fargo: You'd be in the lower-middle range
How Fargo Physical Therapist Pay Compares
Fargo median: $87,429/year (2026)
| Compared To | Median Salary | Fargo Pays |
|---|---|---|
| North Dakota Average | $96,821 | -9.70% less |
| National Average | $105,288 | -16.96% less |
Physical Therapists in Fargo, ND earn a median of $87,429 per year (2026 est.), which is 16.96% lower than the national median of $105,288 and 9.70% below the North Dakota state average of $96,821.
Cost-of-Living Adjusted Salary
Fargo has a cost of living 9.13% below the national average, meaning your salary goes further here.
Adjusted salary = nominal × (100 / CoL index). CoL index: 100 = national average.
Fargo, ND has a cost-of-living index of 90.871 (below the national average of 100). A physical therapist earning $87,429 nominally has purchasing power equivalent to $96,212 in an average-cost city — an effective 10.05% boost.
Compare Purchasing Power
Select a city to see how your salary compares after cost of living
Select a city above to compare purchasing power
2019 BLS Actual
$77,920
2025 BLS Actual
$85,330
2026 Current Est.
$87,429
2019–2027 Growth
+15.0%
Salary Trajectory for Physical Therapists in Fargo (2019–2027)
2019–2025: actual BLS OEWS data for this metro area. 2026+: CAGR 2.46% projection.
| Year | Annual Salary | Status |
|---|---|---|
| 2019 | $77,920 | Actual |
| 2020 | $80,760 | Actual |
| 2021 | $77,430 | Actual |
| 2022 | $78,920 | Actual |
| 2023 | $89,270 | Actual |
| 2024 | $85,480 | Actual |
| 2025 | $85,330 | Actual |
| 2026(current) | $87,429 | Estimated |
| 2027 | $89,580 | Projected |
Based on 7 years of BLS OEWS data for the Fargo metropolitan area, the median physical therapist salary grew 9.5% from $77,920 (2019) to $85,330 (2025). At a 2.46% compound annual growth rate, salaries are projected to reach $89,580 by 2027 — a total increase of $11,660 (14.96%) from 2019.
Note: Historical values (2019–2025) are actual BLS OEWS figures for the Fargo metropolitan area, sourced from annual Occupational Employment and Wage Statistics surveys. 2026–2026 figures are current estimates, and 2027 values are projections, calculated using a 2.46% CAGR derived from 7-year BLS historical data. Actual salaries may vary based on employer, experience, certifications, and local market conditions.
Salary by Experience Level
| Experience | Estimated Salary Range |
|---|---|
| 0-2 years (New Graduate) | $77,142 – $81,025 |
| 3-5 years (Mid Career) | $81,025 – $87,429 |
| 5+ years (Experienced) | $87,429 – $105,657 |
| 10+ years (Top Earner) | $105,657 – $110,462 |
PT salary ranges estimated from BLS percentile data. Individual physical therapist compensation varies by employer, certifications, and specialization.
Physical Therapist Job Market in Fargo
In Fargo, the cost of living index sits at 90.871, which reinforces the relevance of salary figures when assessing take-home purchasing power for physical therapists. Within this dynamic market, employers such as outpatient orthopedic clinics, skilled nursing facilities, and hospital inpatient rehab centers often offer varied compensation levels. Productivity models also play a significant role in determining pay, with higher salaries typically associated with settings that adopt a cash-pay system or those that place enhance focus on maximizing patient visits per day. Furthermore, physical therapists with board certifications like OCS or SCS can often command higher stipends, especially in competitive environments. To maximize earnings in Fargo, aspiring therapists should consider seeking opportunities in high-demand settings and pursuing advanced certifications that can elevate their market value, while also navigating the trends of productivity benchmarks and insurance reimbursements that currently shape the field.
More salary data for Fargo, ND:
Frequently Asked Questions
How much do physical therapists make in Fargo, ND in 2026?
Is Fargo, ND a good place to work as a physical therapist?
Can physical therapists make $100K in Fargo?
What is the cost-of-living adjusted physical therapist salary in Fargo?
How much does a physical therapist make per hour in Fargo?
Related Pages
Compare Salaries
Career Resources
Nearby Cities in North Dakota
Written by Alex Morgan, DPT
Career Analyst
Alex Morgan has over 10 years of experience in physical therapy. They specialize in orthopedic rehabilitation. Alex works in a private practice setting.
Methodology & Data Source
Salary figures on this page are 2026 projections based on the Bureau of Labor Statistics Occupational Employment and Wage Statistics (OEWS) survey, May 2026 release. The BLS reported a median annual salary of $85,330 for physical therapistsin the Fargo metropolitan area. A 2.46% compound annual growth rate (CAGR), calculated from 6-year national BLS wage trends, was applied to project current 2026 compensation. Percentile ranges (P10–P90) represent the full salary distribution across experience levels and practice settings in this market.
Data Sources & Methodology
Source: BLS, OEWS, 7-year dataset (–). Per-city data from annual BLS metropolitan area surveys.
2026 figures are projected from 2025 BLS data using a compound annual growth rate (CAGR) of 2.46%, derived from historical BLS wage trends for physical therapists (SOC 29-1123).
Compiled and verified by Alex Morgan, DPT, a licensed physical therapist with 10+ years of clinical experience. · View source data at BLS.gov