Physical Therapist Salary in Grand Forks, ND: $90,851 (2026)
Quick Answer:A full-time physical therapist in Grand Forks, ND earns a median $90,851/year (≈ $43.68/hour) in nominal terms for 2026 — projected from BLS OEWS 2025 (SOC 29-1123). Once you factor in Grand Forks's price level (13% below national, BEA RPP 86.7), that paycheck buys what $104,833 would nationally. Nominal pay sits 6.2% below the North Dakota state average.
Official BLS data · View source
In 2026, physical therapist salaries in Grand Forks, North Dakota, reflect the unique dynamics of the local healthcare landscape. The median annual compensation is projected at $90,851, which is notably lower than the national median of $105,288. Salary ranges vary widely, with entry-level positions starting around $76,507 and experienced therapists making upwards of $118,044. These estimates arise from rigorous surveys conducted by the Bureau of Labor Statistics (BLS), highlighting a market in which outpatient orthopedic clinics, hospital settings, and skilled nursing facilities vie for skilled professionals. As physical therapists weigh opportunities, understanding how structural choices within these categories impact pay will be essential when considering their career trajectory in the city.
Salary Breakdown
| Percentile | Annual | Hourly |
|---|---|---|
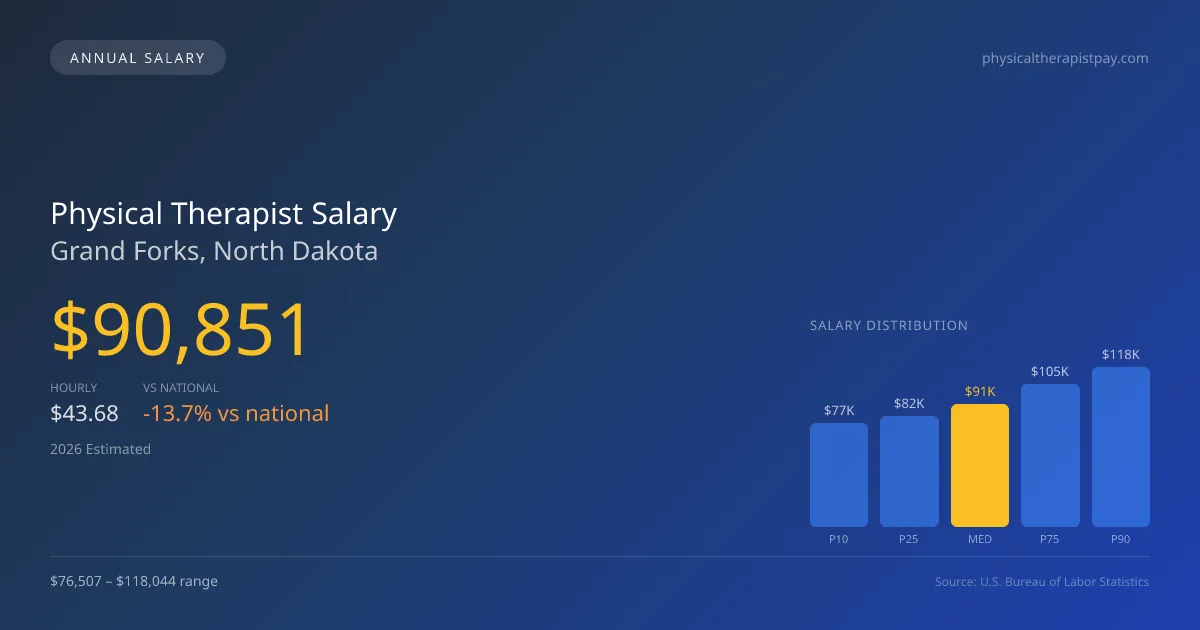
| Entry Level (P10) | $76,507 | $36.78 |
| Lower Range (P25) | $81,927 | $39.39 |
| Median (P50)(typical) | $90,851 | $43.68 |
| Upper Range (P75) | $105,472 | $50.71 |
| Top Earners (P90) | $118,044 | $56.75 |
Median Salary Position
13.71% below the national average
2026 Salary Percentile Distribution in Grand Forks
In Grand Forks, ND, the physical therapist salary spread from the 10th to 90th percentile is $41,537 (2026 est.). At $90,851, the local median is 13.71% below the national median of $105,288.
Salary Calculator
At 40 hours/week in Grand Forks: You'd be in the lower-middle range
How Grand Forks Physical Therapist Pay Compares
Grand Forks median: $90,851/year (2026)
| Compared To | Median Salary | Grand Forks Pays |
|---|---|---|
| North Dakota Average | $96,856 | -6.20% less |
| National Average | $105,288 | -13.71% less |
Physical Therapists in Grand Forks, ND earn a median of $90,851 per year (2026 est.), which is 13.71% lower than the national median of $105,288 and 6.20% below the North Dakota state average of $96,856.
Cost-of-Living Adjusted Salary
Grand Forks has a cost of living 13.34% below the national average, meaning your salary goes further here.
Adjusted salary = nominal × (100 / CoL index). CoL index: 100 = national average.
Grand Forks, ND has a cost-of-living index of 86.663 (below the national average of 100). A physical therapist earning $90,851 nominally has purchasing power equivalent to $104,833 in an average-cost city — an effective 15.39% boost.
Compare Purchasing Power
Select a city to see how your salary compares after cost of living
Select a city above to compare purchasing power
2019 BLS Actual
$77,176
2025 BLS Actual
$88,670
2026 Current Est.
$90,851
2019–2027 Growth
+20.6%
Salary Trajectory for Physical Therapists in Grand Forks (2019–2027)
2019–2025: actual BLS OEWS data for this metro area. 2026+: CAGR 2.46% projection.
| Year | Annual Salary | Status |
|---|---|---|
| 2019 | $77,176 | Actual |
| 2020 | $78,531 | Actual |
| 2021 | $76,140 | Actual |
| 2022 | $79,220 | Actual |
| 2023 | $82,830 | Actual |
| 2024 | $85,480 | Actual |
| 2025 | $88,670 | Actual |
| 2026(current) | $90,851 | Estimated |
| 2027 | $93,086 | Projected |
Based on 7 years of BLS OEWS data for the Grand Forks metropolitan area, the median physical therapist salary grew 14.9% from $77,176 (2019) to $88,670 (2025). At a 2.46% compound annual growth rate, salaries are projected to reach $93,086 by 2027 — a total increase of $15,910 (20.62%) from 2019.
Note: Historical values (2019–2025) are actual BLS OEWS figures for the Grand Forks metropolitan area, sourced from annual Occupational Employment and Wage Statistics surveys. 2026–2026 figures are current estimates, and 2027 values are projections, calculated using a 2.46% CAGR derived from 7-year BLS historical data. Actual salaries may vary based on employer, experience, certifications, and local market conditions.
Salary by Experience Level
| Experience | Estimated Salary Range |
|---|---|
| 0-2 years (New Graduate) | $76,507 – $81,927 |
| 3-5 years (Mid Career) | $81,927 – $90,851 |
| 5+ years (Experienced) | $90,851 – $105,472 |
| 10+ years (Top Earner) | $105,472 – $118,044 |
PT salary ranges estimated from BLS percentile data. Individual physical therapist compensation varies by employer, certifications, and specialization.
Physical Therapist Job Market in Grand Forks
Examining the employment context, Grand Forks features about 100 physical therapists serving a population in a region with a cost-of-living index of 86.663. This relatively low index means that take-home salaries translate into better purchasing power; however, the competitive nature of physical therapist pay in Grand Forks ND can vary significantly based on employer type. Outpatient clinics often pay less than hospitals, though they may offer productivity bonuses that appeal to therapists sharp on metrics. Understanding factors like productivity expectations, board certification stipends, and the differences inherent in cash-pay versus insurance practices can empower professionals to negotiate better salaries. To maximize earnings potential, therapists should consider pathways like board specialties, which may provide access to higher-paying roles, and seek out clinics known for valuing both clinical outcomes and staff retention.
More salary data for Grand Forks, ND:
Frequently Asked Questions
How much do physical therapists make in Grand Forks, ND in 2026?
Is Grand Forks, ND a good place to work as a physical therapist?
Can physical therapists make $100K in Grand Forks?
What is the cost-of-living adjusted physical therapist salary in Grand Forks?
How much does a physical therapist make per hour in Grand Forks?
Related Pages
Compare Salaries
Career Resources
Nearby Cities in North Dakota
Written by Alex Morgan, DPT
Career Analyst
Alex Morgan has over 10 years of experience in physical therapy. They specialize in orthopedic rehabilitation. Alex works in a private practice setting.
Methodology & Data Source
Salary figures on this page are 2026 projections based on the Bureau of Labor Statistics Occupational Employment and Wage Statistics (OEWS) survey, May 2026 release. The BLS reported a median annual salary of $88,670 for physical therapistsin the Grand Forks metropolitan area. A 2.46% compound annual growth rate (CAGR), calculated from 6-year national BLS wage trends, was applied to project current 2026 compensation. Percentile ranges (P10–P90) represent the full salary distribution across experience levels and practice settings in this market.
Data Sources & Methodology
Source: BLS, OEWS, 5-year dataset (–). Per-city data from annual BLS metropolitan area surveys.
2026 figures are projected from 2025 BLS data using a compound annual growth rate (CAGR) of 2.46%, derived from historical BLS wage trends for physical therapists (SOC 29-1123).
Compiled and verified by Alex Morgan, DPT, a licensed physical therapist with 10+ years of clinical experience. · View source data at BLS.gov