Physical Therapist Salary in Springfield, OH: $107,450 (2026)
Quick Answer:A full-time physical therapist in Springfield, OH earns a median $107,450/year (≈ $51.66/hour) in nominal terms for 2026 — projected from BLS OEWS 2025 (SOC 29-1123). Once you factor in Springfield's price level (10% below national, BEA RPP 90.5), that paycheck buys what $118,753 would nationally. Nominal pay sits 2.0% above the Ohio state average.
Official BLS data · View source
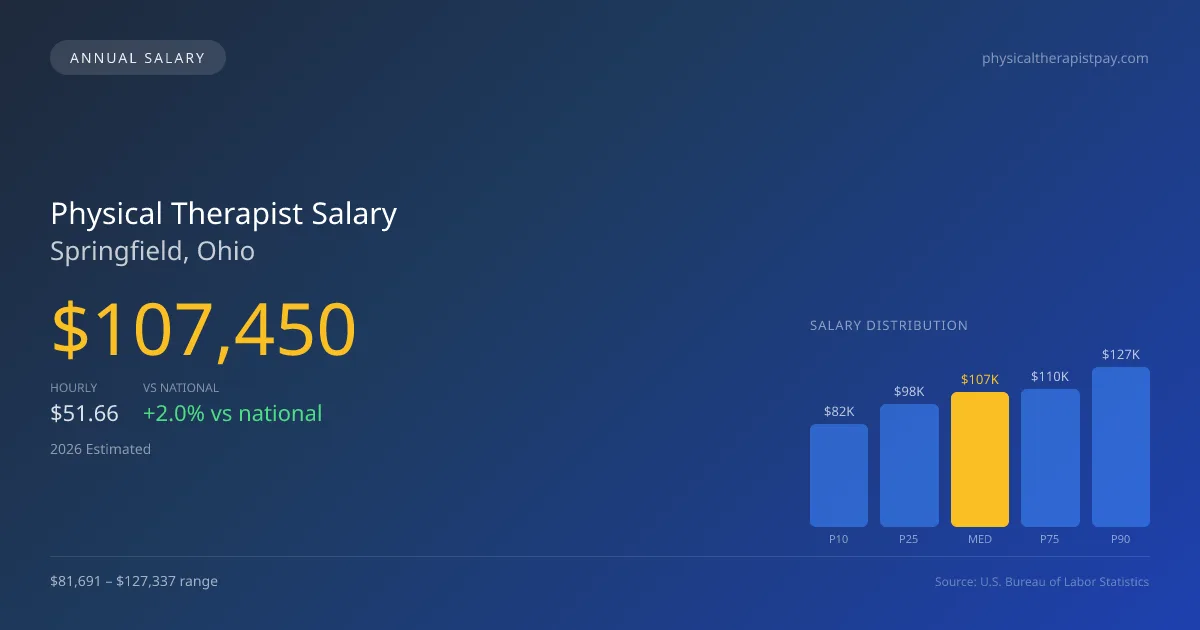
In the competitive landscape of physical therapy in Springfield, Ohio, 2026 projects a median annual salary of $107,450 for professionals in the field. This figure reflects a positive trend, slightly surpassing the national median of $105,288. The salary range in Springfield indicates a robust market environment, with entry-level positions earning around $81,691 and seasoned therapists reaching up to $127,337. Such financial dynamics can be attributed to the rising demand for cash-pay sports and orthopedic therapy models, which tend to boost top-tier compensation rates. These insights are derived from research based on 2025 BLS OEWS data, projected to 2026, highlighting a growing job market that sustains nearly 70 physical therapists in the Springfield area.
Salary Breakdown
| Percentile | Annual | Hourly |
|---|---|---|
| Entry Level (P10) | $81,691 | $39.27 |
| Lower Range (P25) | $98,126 | $47.18 |
| Median (P50)(typical) | $107,450 | $51.66 |
| Upper Range (P75) | $109,960 | $52.87 |
| Top Earners (P90) | $127,337 | $61.22 |
Median Salary Position
2.05% above the national average
2026 Salary Percentile Distribution in Springfield
In Springfield, OH, the physical therapist salary spread from the 10th to 90th percentile is $45,646 (2026 est.). At $107,450, the local median is 2.05% above the national median of $105,288.
Salary Calculator
At 40 hours/week in Springfield: You'd be above the median
How Springfield Physical Therapist Pay Compares
Springfield median: $107,450/year (2026)
| Compared To | Median Salary | Springfield Pays |
|---|---|---|
| Ohio Average | $105,343 | +2.00% more |
| National Average | $105,288 | +2.05% more |
Physical Therapists in Springfield, OH earn a median of $107,450 per year (2026 est.), which is 2.05% higher than the national median of $105,288 and 2.00% above the Ohio state average of $105,343.
Cost-of-Living Adjusted Salary
Springfield has a cost of living 9.52% below the national average, meaning your salary goes further here.
Adjusted salary = nominal × (100 / CoL index). CoL index: 100 = national average.
Springfield, OH has a cost-of-living index of 90.482 (below the national average of 100). A physical therapist earning $107,450 nominally has purchasing power equivalent to $118,753 in an average-cost city — an effective 10.52% boost.
Compare Purchasing Power
Select a city to see how your salary compares after cost of living
Select a city above to compare purchasing power
2019 BLS Actual
$84,190
2025 BLS Actual
$104,870
2026 Current Est.
$107,450
2019–2027 Growth
+30.8%
Salary Trajectory for Physical Therapists in Springfield (2019–2027)
2019–2025: actual BLS OEWS data for this metro area. 2026+: CAGR 2.46% projection.
| Year | Annual Salary | Status |
|---|---|---|
| 2019 | $84,190 | Actual |
| 2020 | $85,370 | Actual |
| 2021 | $95,080 | Actual |
| 2022 | $97,240 | Actual |
| 2023 | $95,980 | Actual |
| 2024 | $101,090 | Actual |
| 2025 | $104,870 | Actual |
| 2026(current) | $107,450 | Estimated |
| 2027 | $110,093 | Projected |
Based on 7 years of BLS OEWS data for the Springfield metropolitan area, the median physical therapist salary grew 24.6% from $84,190 (2019) to $104,870 (2025). At a 2.46% compound annual growth rate, salaries are projected to reach $110,093 by 2027 — a total increase of $25,903 (30.77%) from 2019.
Note: Historical values (2019–2025) are actual BLS OEWS figures for the Springfield metropolitan area, sourced from annual Occupational Employment and Wage Statistics surveys. 2026–2026 figures are current estimates, and 2027 values are projections, calculated using a 2.46% CAGR derived from 7-year BLS historical data. Actual salaries may vary based on employer, experience, certifications, and local market conditions.
Salary by Experience Level
| Experience | Estimated Salary Range |
|---|---|
| 0-2 years (New Graduate) | $81,691 – $98,126 |
| 3-5 years (Mid Career) | $98,126 – $107,450 |
| 5+ years (Experienced) | $107,450 – $109,960 |
| 10+ years (Top Earner) | $109,960 – $127,337 |
PT salary ranges estimated from BLS percentile data. Individual physical therapist compensation varies by employer, certifications, and specialization.
Physical Therapist Job Market in Springfield
While the salary figures may seem promising, it's essential to consider the cost of living in Springfield, which has a cost-of-living index of 90.482, indicating a lower-than-average expense for residents. This reality influences the local physical therapist pay in Springfield, OH, as the purchasing power of therapists is complemented by reduced living costs. Outpatient orthopedic clinics, such as Athletico and ATI, often lead in compensation among local employers, yet the financial incentives can vary significantly by practice type. Factors such as productivity expectations, specialized board certifications (like OCS or SCS), clinic ownership equity, and the choice between cash-pay versus insurance-based models all contribute to the salary spread. To maximize earnings, physical therapists in Springfield may benefit from pursuing specialization, aiming for roles in high-demand environments, and maintaining flexibility in practice models to capture varied patient demographics.
More salary data for Springfield, OH:
Frequently Asked Questions
How much do physical therapists make in Springfield, OH in 2026?
Is Springfield, OH a good place to work as a physical therapist?
Can physical therapists make $100K in Springfield?
What is the cost-of-living adjusted physical therapist salary in Springfield?
How much does a physical therapist make per hour in Springfield?
Related Pages
Compare Salaries
Career Resources
Written by Alex Morgan, DPT
Career Analyst
Alex Morgan has over 10 years of experience in physical therapy. They specialize in orthopedic rehabilitation. Alex works in a private practice setting.
Methodology & Data Source
Salary figures on this page are 2026 projections based on the Bureau of Labor Statistics Occupational Employment and Wage Statistics (OEWS) survey, May 2026 release. The BLS reported a median annual salary of $104,870 for physical therapistsin the Springfield metropolitan area. A 2.46% compound annual growth rate (CAGR), calculated from 6-year national BLS wage trends, was applied to project current 2026 compensation. Percentile ranges (P10–P90) represent the full salary distribution across experience levels and practice settings in this market.
Data Sources & Methodology
Source: BLS, OEWS, 7-year dataset (–). Per-city data from annual BLS metropolitan area surveys.
2026 figures are projected from 2025 BLS data using a compound annual growth rate (CAGR) of 2.46%, derived from historical BLS wage trends for physical therapists (SOC 29-1123).
Compiled and verified by Alex Morgan, DPT, a licensed physical therapist with 10+ years of clinical experience. · View source data at BLS.gov