Physical Therapist Salary in Xenia, OH: $99,814 (2026)
Quick Answer:A full-time physical therapist in Xenia, OH earns a median $99,814/year (≈ $47.99/hour) in nominal terms for 2026 — projected from BLS OEWS 2025 (SOC 29-1123). Once you factor in Xenia's price level (9% below national, BEA RPP 90.7), that paycheck buys what $110,049 would nationally. Nominal pay sits 5.2% below the Ohio state average.
Based on BLS state-level estimates · View source
In 2026, physical therapist salary in Xenia is projected to reach a median of $99,814, providing a competitive, though slightly lower, compensation compared to the national median of $105,288. The salary range here spans from $77,951 at the 10th percentile to $125,213 at the 90th percentile, indicating a notable variation in earnings based on factors such as experience and specialization. These figures, derived from 2025 BLS data projected to 2026, reflect the local market factors including reimbursement trends and the high productivity expectations that influence actual take-home pay. As Xenia maintains a modest population of only seven physical therapists, competition for higher-paying positions may create unique opportunities and challenges within the area.
About the Xenia Market
Salary estimated from Ohio average ($90,000) adjusted for local cost of living.
Salary Breakdown
| Percentile | Annual | Hourly |
|---|---|---|
| Entry Level (P10) | $77,951 | $37.48 |
| Lower Range (P25) | $84,736 | $40.74 |
| Median (P50)(typical) | $99,814 | $47.99 |
| Upper Range (P75) | $115,357 | $55.46 |
| Top Earners (P90) | $125,213 | $60.20 |
Median Salary Position
5.2% below the national average
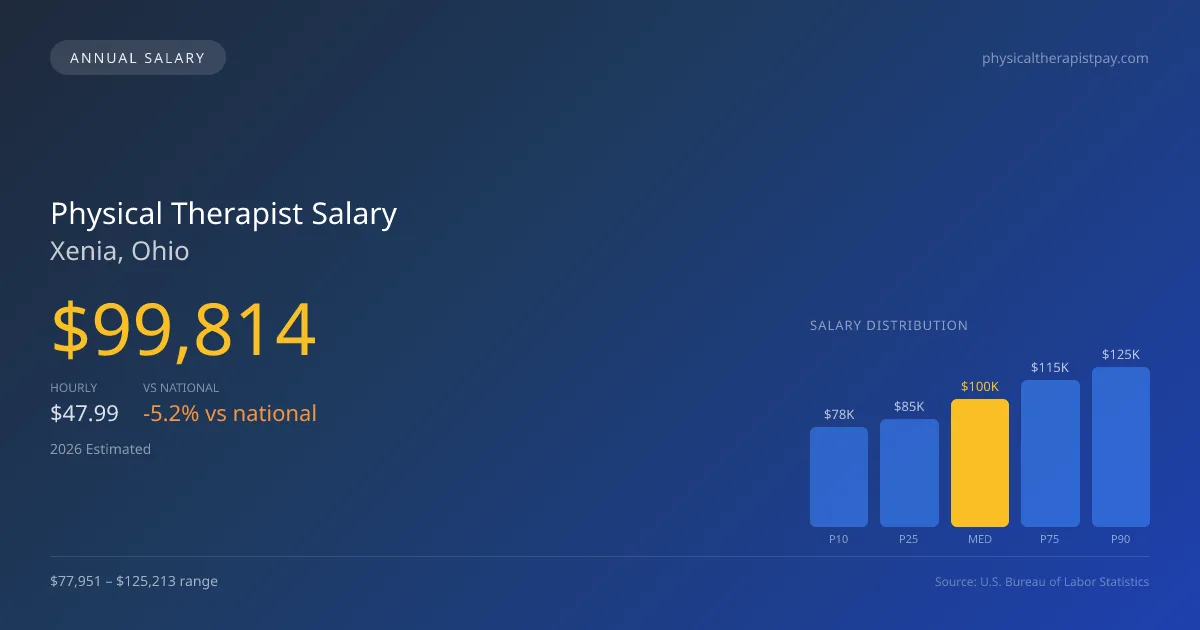
2026 Salary Percentile Distribution in Xenia
In Xenia, OH, the physical therapist salary spread from the 10th to 90th percentile is $47,262 (2026 est.). At $99,814, the local median is 5.2% below the national median of $105,288.
Salary Calculator
At 40 hours/week in Xenia: You'd be in the lower-middle range
How Xenia Physical Therapist Pay Compares
Xenia median: $99,814/year (2026)
| Compared To | Median Salary | Xenia Pays |
|---|---|---|
| Ohio Average | $105,290 | -5.20% less |
| National Average | $105,288 | -5.20% less |
Physical Therapists in Xenia, OH earn a median of $99,814 per year (2026 est.), which is 5.20% lower than the national median of $105,288 and 5.20% below the Ohio state average of $105,290.
Cost-of-Living Adjusted Salary
Xenia has a cost of living 9.30% below the national average, meaning your salary goes further here.
Adjusted salary = nominal × (100 / CoL index). CoL index: 100 = national average.
Xenia, OH has a cost-of-living index of 90.7 (below the national average of 100). A physical therapist earning $99,814 nominally has purchasing power equivalent to $110,049 in an average-cost city — an effective 10.25% boost.
Compare Purchasing Power
Select a city to see how your salary compares after cost of living
Select a city above to compare purchasing power
2019 BLS Actual
$84,790
2025 BLS Actual
$97,418
2026 Current Est.
$99,814
2019–2027 Growth
+20.6%
Salary Trajectory for Physical Therapists in Xenia (2019–2027)
2019–2025: actual BLS OEWS data for this metro area. 2026+: CAGR 2.46% projection.
| Year | Annual Salary | Status |
|---|---|---|
| 2019 | $84,790 | Actual |
| 2020 | $86,279 | Actual |
| 2021 | $90,649 | Actual |
| 2022 | $92,640 | Actual |
| 2023 | $94,527 | Actual |
| 2024 | $77,360 | Actual |
| 2025 | $97,418 | Actual |
| 2026(current) | $99,814 | Estimated |
| 2027 | $102,270 | Projected |
Based on 7 years of BLS OEWS data for the Xenia metropolitan area, the median physical therapist salary grew 14.9% from $84,790 (2019) to $97,418 (2025). At a 2.46% compound annual growth rate, salaries are projected to reach $102,270 by 2027 — a total increase of $17,480 (20.62%) from 2019.
Note: Historical values (2019–2025) are actual BLS OEWS figures for the Xenia metropolitan area, sourced from annual Occupational Employment and Wage Statistics surveys. 2026–2026 figures are current estimates, and 2027 values are projections, calculated using a 2.46% CAGR derived from 7-year BLS historical data. Actual salaries may vary based on employer, experience, certifications, and local market conditions.
Salary by Experience Level
| Experience | Estimated Salary Range |
|---|---|
| 0-2 years (New Graduate) | $77,951 – $84,736 |
| 3-5 years (Mid Career) | $84,736 – $99,814 |
| 5+ years (Experienced) | $99,814 – $115,357 |
| 10+ years (Top Earner) | $115,357 – $125,213 |
PT salary ranges estimated from BLS percentile data. Individual physical therapist compensation varies by employer, certifications, and specialization.
Physical Therapist Job Market in Xenia
Focusing on the local job market, Xenia’s cost-of-living index stands at 90.7, which is below the national average, providing a bit of context for the purchasing power of physical therapist pay in Xenia, OH. With only seven physical therapists currently employed, job seekers should consider outpatient orthopedic clinics as promising employers, particularly those with productivity bonuses, despite potential lower base salaries compared to hospital systems. Factors that can drive pay differences include board certification stipends, ownership equity, and the growing trend towards cash-pay models over traditional insurance pathways. To maximize earning potential, physical therapists in this market should aim to achieve specialized certifications like OCS or SCS, while also actively seeking opportunities in settings that reward higher productivity levels.
More salary data for Xenia, OH:
Frequently Asked Questions
How much do physical therapists make in Xenia, OH in 2026?
Is Xenia, OH a good place to work as a physical therapist?
Can physical therapists make $100K in Xenia?
What is the cost-of-living adjusted physical therapist salary in Xenia?
How much does a physical therapist make per hour in Xenia?
Related Pages
Compare Salaries
Career Resources
Written by Alex Morgan, DPT
Career Analyst
Alex Morgan has over 10 years of experience in physical therapy. They specialize in orthopedic rehabilitation. Alex works in a private practice setting.
Methodology & Data Source
Salary figures on this page are 2026 projections based on the Bureau of Labor Statistics Occupational Employment and Wage Statistics (OEWS) survey, May 2026 release. The BLS reported a median annual salary of $97,418 for physical therapistsin the Xenia metropolitan area. A 2.46% compound annual growth rate (CAGR), calculated from 6-year national BLS wage trends, was applied to project current 2026 compensation. Percentile ranges (P10–P90) represent the full salary distribution across experience levels and practice settings in this market.
Data Sources & Methodology
Salary data for Xenia is estimated from official BLS state-level occupational wage data (2025), adjusted for regional cost-of-living differences using BEA RPP (Regional Price Parities).
2026 figures are projected from 2025 BLS data using a compound annual growth rate (CAGR) of 2.46%, derived from historical BLS wage trends for physical therapists (SOC 29-1123).
Compiled and verified by Alex Morgan, DPT, a licensed physical therapist with 10+ years of clinical experience. · View source data at BLS.gov