Physical Therapist Salary in Claremore, OK: $89,185 (2026)
Quick Answer:A full-time physical therapist in Claremore, OK earns a median $89,185/year (≈ $42.88/hour) in nominal terms for 2026 — projected from BLS OEWS 2025 (SOC 29-1123). Once you factor in Claremore's price level (11% below national, BEA RPP 88.9), that paycheck buys what $100,321 would nationally. Nominal pay sits 4.7% below the Oklahoma state average.
Based on BLS state-level estimates · View source
In Claremore, Oklahoma, the projected median salary for physical therapists in 2026 is set at $89,185, which reflects a competitive, though somewhat lower, position compared to the national average of $105,288. The salary range for this profession varies significantly, with entry-level positions earning around $69,748 while experienced therapists can command up to $109,238. These figures are derived from 2025 BLS data, adjusted for regional costs in Claremore, where economic factors and local market trends influence compensation levels. As the trend towards cash-pay models for sports and orthopedic specialties grows, this may be driving higher-end pay rates, impacting the overall salary landscape for physical therapists in Claremore.
About the Claremore Market
Salary estimated from Oklahoma average ($90,000) adjusted for local cost of living.
Salary Breakdown
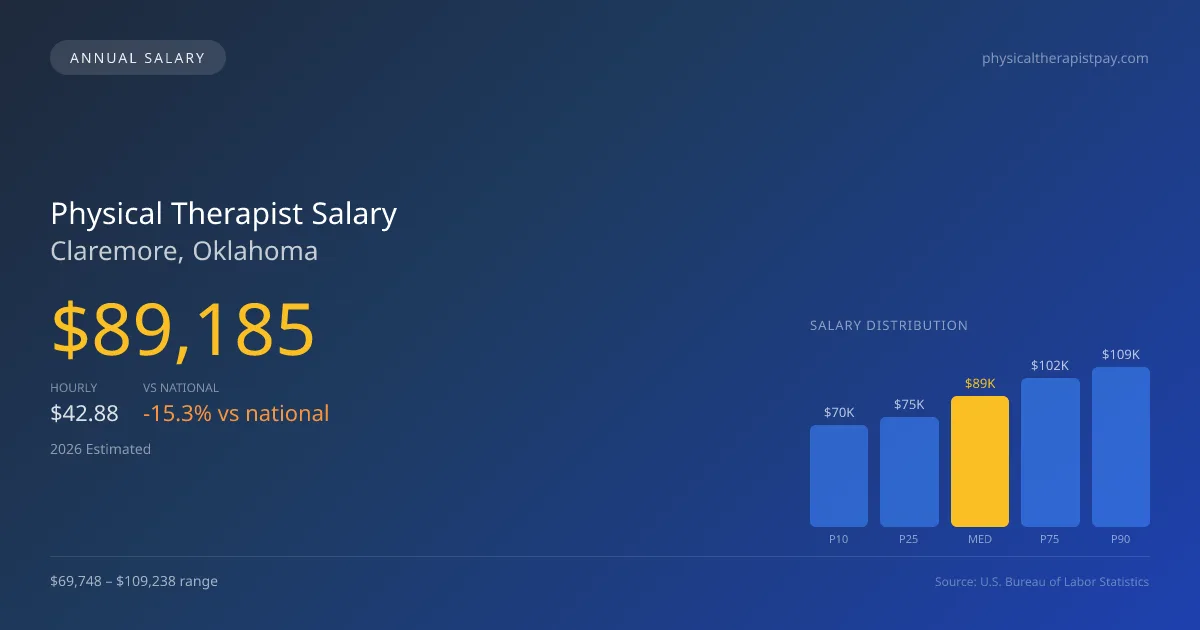
| Percentile | Annual | Hourly |
|---|---|---|
| Entry Level (P10) | $69,748 | $33.54 |
| Lower Range (P25) | $75,436 | $36.27 |
| Median (P50)(typical) | $89,185 | $42.88 |
| Upper Range (P75) | $101,906 | $49.00 |
| Top Earners (P90) | $109,238 | $52.52 |
Median Salary Position
15.29% below the national average
2026 Salary Percentile Distribution in Claremore
In Claremore, OK, the physical therapist salary spread from the 10th to 90th percentile is $39,490 (2026 est.). At $89,185, the local median is 15.29% below the national median of $105,288.
Salary Calculator
At 40 hours/week in Claremore: You'd be in the lower-middle range
How Claremore Physical Therapist Pay Compares
Claremore median: $89,185/year (2026)
| Compared To | Median Salary | Claremore Pays |
|---|---|---|
| Oklahoma Average | $93,584 | -4.70% less |
| National Average | $105,288 | -15.29% less |
Physical Therapists in Claremore, OK earn a median of $89,185 per year (2026 est.), which is 15.29% lower than the national median of $105,288 and 4.70% below the Oklahoma state average of $93,584.
Cost-of-Living Adjusted Salary
Claremore has a cost of living 11.10% below the national average, meaning your salary goes further here.
Adjusted salary = nominal × (100 / CoL index). CoL index: 100 = national average.
Claremore, OK has a cost-of-living index of 88.9 (below the national average of 100). A physical therapist earning $89,185 nominally has purchasing power equivalent to $100,321 in an average-cost city — an effective 12.49% boost.
Compare Purchasing Power
Select a city to see how your salary compares after cost of living
Select a city above to compare purchasing power
2019 BLS Actual
$75,761
2025 BLS Actual
$87,044
2026 Current Est.
$89,185
2019–2027 Growth
+20.6%
Salary Trajectory for Physical Therapists in Claremore (2019–2027)
2019–2025: actual BLS OEWS data for this metro area. 2026+: CAGR 2.46% projection.
| Year | Annual Salary | Status |
|---|---|---|
| 2019 | $75,761 | Actual |
| 2020 | $77,091 | Actual |
| 2021 | $80,996 | Actual |
| 2022 | $82,775 | Actual |
| 2023 | $84,460 | Actual |
| 2024 | $76,235 | Actual |
| 2025 | $87,044 | Actual |
| 2026(current) | $89,185 | Estimated |
| 2027 | $91,379 | Projected |
Based on 7 years of BLS OEWS data for the Claremore metropolitan area, the median physical therapist salary grew 14.9% from $75,761 (2019) to $87,044 (2025). At a 2.46% compound annual growth rate, salaries are projected to reach $91,379 by 2027 — a total increase of $15,618 (20.61%) from 2019.
Note: Historical values (2019–2025) are actual BLS OEWS figures for the Claremore metropolitan area, sourced from annual Occupational Employment and Wage Statistics surveys. 2026–2026 figures are current estimates, and 2027 values are projections, calculated using a 2.46% CAGR derived from 7-year BLS historical data. Actual salaries may vary based on employer, experience, certifications, and local market conditions.
Salary by Experience Level
| Experience | Estimated Salary Range |
|---|---|
| 0-2 years (New Graduate) | $69,748 – $75,436 |
| 3-5 years (Mid Career) | $75,436 – $89,185 |
| 5+ years (Experienced) | $89,185 – $101,906 |
| 10+ years (Top Earner) | $101,906 – $109,238 |
PT salary ranges estimated from BLS percentile data. Individual physical therapist compensation varies by employer, certifications, and specialization.
Physical Therapist Job Market in Claremore
The job market for physical therapists in Claremore remains relatively modest, with only six professionals currently employed in the area. The cost of living index is notably low at 88.9, which can enhance take-home purchasing power despite lower salaries relative to national figures. Employers such as outpatient orthopedic clinics, including organizations like Athletico and ATI, may offer the most lucrative positions, often providing productivity bonuses and incentivizing high-volume care. Differences in salaries can also be attributed to factors like board certification stipends, clinic ownership opportunities, and practice type—cash-pay models typically yield higher earnings. To maximize pay in Claremore, physical therapists should focus on increasing their productivity metrics, pursuing specialization certifications through groups like APTA, and considering positions that offer ownership and equity stakes in their practice.
More salary data for Claremore, OK:
Frequently Asked Questions
How much do physical therapists make in Claremore, OK in 2026?
Is Claremore, OK a good place to work as a physical therapist?
Can physical therapists make $100K in Claremore?
What is the cost-of-living adjusted physical therapist salary in Claremore?
How much does a physical therapist make per hour in Claremore?
Related Pages
Compare Salaries
Career Resources
Nearby Cities in Oklahoma
Written by Alex Morgan, DPT
Career Analyst
Alex Morgan has over 10 years of experience in physical therapy. They specialize in orthopedic rehabilitation. Alex works in a private practice setting.
Methodology & Data Source
Salary figures on this page are 2026 projections based on the Bureau of Labor Statistics Occupational Employment and Wage Statistics (OEWS) survey, May 2026 release. The BLS reported a median annual salary of $87,044 for physical therapistsin the Claremore metropolitan area. A 2.46% compound annual growth rate (CAGR), calculated from 6-year national BLS wage trends, was applied to project current 2026 compensation. Percentile ranges (P10–P90) represent the full salary distribution across experience levels and practice settings in this market.
Data Sources & Methodology
Salary data for Claremore is estimated from official BLS state-level occupational wage data (2025), adjusted for regional cost-of-living differences using BEA RPP (Regional Price Parities).
2026 figures are projected from 2025 BLS data using a compound annual growth rate (CAGR) of 2.46%, derived from historical BLS wage trends for physical therapists (SOC 29-1123).
Compiled and verified by Alex Morgan, DPT, a licensed physical therapist with 10+ years of clinical experience. · View source data at BLS.gov