Physical Therapist Salary in Sapulpa, OK: $88,277 (2026)
Quick Answer:A full-time physical therapist in Sapulpa, OK earns a median $88,277/year (≈ $42.44/hour) in nominal terms for 2026 — projected from BLS OEWS 2025 (SOC 29-1123). Once you factor in Sapulpa's price level (11% below national, BEA RPP 88.9), that paycheck buys what $99,299 would nationally. Nominal pay sits 5.7% below the Oklahoma state average.
Based on BLS state-level estimates · View source
In Sapulpa, Oklahoma, physical therapists can expect a median annual salary around $88,277 in 2026, which reflects a notable gap when compared to the national average of $105,288. The local salary spectrum ranges from $67,198 at the lower end (P10) to $111,897 at the upper end (P90), presenting a clear distinction in compensation based on experience and specialization. These figures are derived from estimates based on 2025 BLS data, adjusted for regional cost of living, which is currently indexed at 88.9, indicating a lower-than-average living cost in Sapulpa. Thus, while the pay may not match broader national trends, the more affordable living expenses could balance the overall compensation for physical therapists working in the area.
About the Sapulpa Market
Salary estimated from Oklahoma average ($90,000) adjusted for local cost of living.
Salary Breakdown
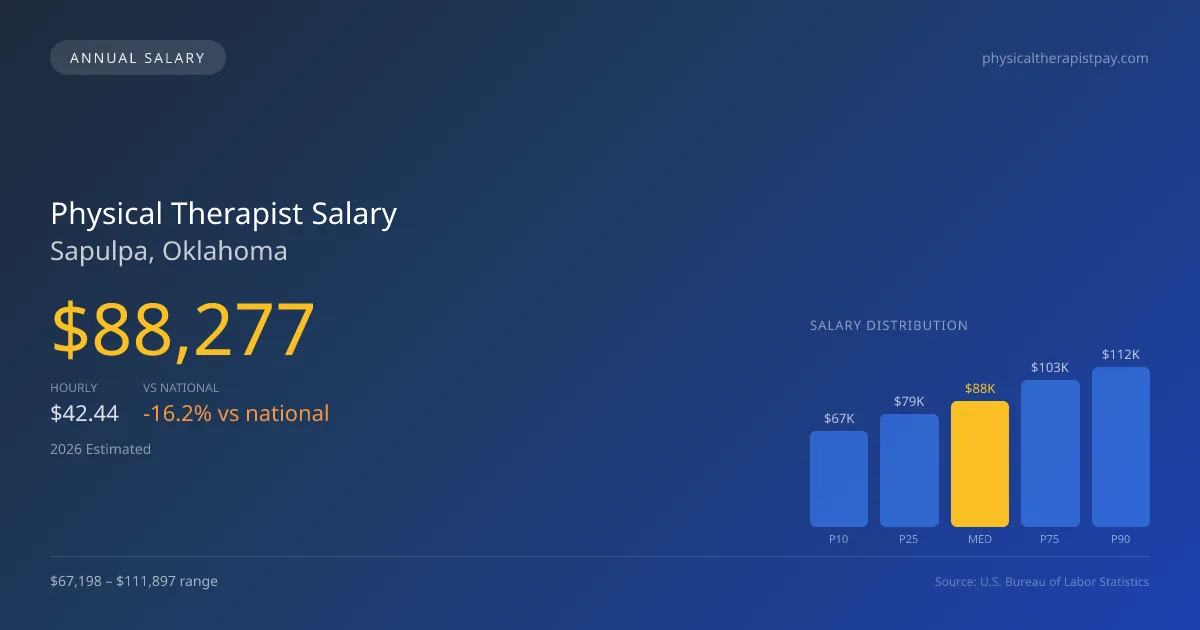
| Percentile | Annual | Hourly |
|---|---|---|
| Entry Level (P10) | $67,198 | $32.31 |
| Lower Range (P25) | $79,004 | $37.98 |
| Median (P50)(typical) | $88,277 | $42.44 |
| Upper Range (P75) | $103,004 | $49.52 |
| Top Earners (P90) | $111,897 | $53.79 |
Median Salary Position
16.16% below the national average
2026 Salary Percentile Distribution in Sapulpa
In Sapulpa, OK, the physical therapist salary spread from the 10th to 90th percentile is $44,699 (2026 est.). At $88,277, the local median is 16.16% below the national median of $105,288.
Salary Calculator
At 40 hours/week in Sapulpa: You'd be in the lower-middle range
How Sapulpa Physical Therapist Pay Compares
Sapulpa median: $88,277/year (2026)
| Compared To | Median Salary | Sapulpa Pays |
|---|---|---|
| Oklahoma Average | $93,613 | -5.70% less |
| National Average | $105,288 | -16.16% less |
Physical Therapists in Sapulpa, OK earn a median of $88,277 per year (2026 est.), which is 16.16% lower than the national median of $105,288 and 5.70% below the Oklahoma state average of $93,613.
Cost-of-Living Adjusted Salary
Sapulpa has a cost of living 11.10% below the national average, meaning your salary goes further here.
Adjusted salary = nominal × (100 / CoL index). CoL index: 100 = national average.
Sapulpa, OK has a cost-of-living index of 88.9 (below the national average of 100). A physical therapist earning $88,277 nominally has purchasing power equivalent to $99,299 in an average-cost city — an effective 12.49% boost.
Compare Purchasing Power
Select a city to see how your salary compares after cost of living
Select a city above to compare purchasing power
2019 BLS Actual
$74,990
2025 BLS Actual
$86,158
2026 Current Est.
$88,277
2019–2027 Growth
+20.6%
Salary Trajectory for Physical Therapists in Sapulpa (2019–2027)
2019–2025: actual BLS OEWS data for this metro area. 2026+: CAGR 2.46% projection.
| Year | Annual Salary | Status |
|---|---|---|
| 2019 | $74,990 | Actual |
| 2020 | $76,306 | Actual |
| 2021 | $80,172 | Actual |
| 2022 | $81,932 | Actual |
| 2023 | $83,601 | Actual |
| 2024 | $75,459 | Actual |
| 2025 | $86,158 | Actual |
| 2026(current) | $88,277 | Estimated |
| 2027 | $90,449 | Projected |
Based on 7 years of BLS OEWS data for the Sapulpa metropolitan area, the median physical therapist salary grew 14.9% from $74,990 (2019) to $86,158 (2025). At a 2.46% compound annual growth rate, salaries are projected to reach $90,449 by 2027 — a total increase of $15,459 (20.61%) from 2019.
Note: Historical values (2019–2025) are actual BLS OEWS figures for the Sapulpa metropolitan area, sourced from annual Occupational Employment and Wage Statistics surveys. 2026–2026 figures are current estimates, and 2027 values are projections, calculated using a 2.46% CAGR derived from 7-year BLS historical data. Actual salaries may vary based on employer, experience, certifications, and local market conditions.
Salary by Experience Level
| Experience | Estimated Salary Range |
|---|---|
| 0-2 years (New Graduate) | $67,198 – $79,004 |
| 3-5 years (Mid Career) | $79,004 – $88,277 |
| 5+ years (Experienced) | $88,277 – $103,004 |
| 10+ years (Top Earner) | $103,004 – $111,897 |
PT salary ranges estimated from BLS percentile data. Individual physical therapist compensation varies by employer, certifications, and specialization.
Physical Therapist Job Market in Sapulpa
The job market for physical therapists in Sapulpa appears stable, with a small cluster of about four professionals currently employed. This limited number may contribute to a competitive environment where high-quality candidates thrive. The favorable cost of living enhances take-home pay, allowing for more purchasing power despite the lower salary averages. Notably, outpatient orthopedic clinics, particularly large chains like ATI and Athletico, emerge as some of the primary employers in the area, although they often offer lower base salaries compared to hospitals. The salary spread is influenced by various factors, including productivity metrics and the potential for bonuses based on visits per day, which are increasingly relevant due to reimbursement pressures from CMS. Professionals looking to maximize their pay in this market should consider obtaining additional board certifications like OCS or SCS and seeking positions in cash-pay environments, which typically offer enhanced compensation packages.
More salary data for Sapulpa, OK:
Frequently Asked Questions
How much do physical therapists make in Sapulpa, OK in 2026?
Is Sapulpa, OK a good place to work as a physical therapist?
Can physical therapists make $100K in Sapulpa?
What is the cost-of-living adjusted physical therapist salary in Sapulpa?
How much does a physical therapist make per hour in Sapulpa?
Related Pages
Compare Salaries
Career Resources
Nearby Cities in Oklahoma
Written by Alex Morgan, DPT
Career Analyst
Alex Morgan has over 10 years of experience in physical therapy. They specialize in orthopedic rehabilitation. Alex works in a private practice setting.
Methodology & Data Source
Salary figures on this page are 2026 projections based on the Bureau of Labor Statistics Occupational Employment and Wage Statistics (OEWS) survey, May 2026 release. The BLS reported a median annual salary of $86,158 for physical therapistsin the Sapulpa metropolitan area. A 2.46% compound annual growth rate (CAGR), calculated from 6-year national BLS wage trends, was applied to project current 2026 compensation. Percentile ranges (P10–P90) represent the full salary distribution across experience levels and practice settings in this market.
Data Sources & Methodology
Salary data for Sapulpa is estimated from official BLS state-level occupational wage data (2025), adjusted for regional cost-of-living differences using BEA RPP (Regional Price Parities).
2026 figures are projected from 2025 BLS data using a compound annual growth rate (CAGR) of 2.46%, derived from historical BLS wage trends for physical therapists (SOC 29-1123).
Compiled and verified by Alex Morgan, DPT, a licensed physical therapist with 10+ years of clinical experience. · View source data at BLS.gov