Physical Therapist Salary in Johnson City, TN: $99,038 (2026)
Quick Answer:A full-time physical therapist in Johnson City, TN earns a median $99,038/year (≈ $47.61/hour) in nominal terms for 2026 — projected from BLS OEWS 2025 (SOC 29-1123). Once you factor in Johnson City's price level (12% below national, BEA RPP 87.9), that paycheck buys what $112,635 would nationally. Nominal pay sits 0.8% below the Tennessee state average.
Official BLS data · View source
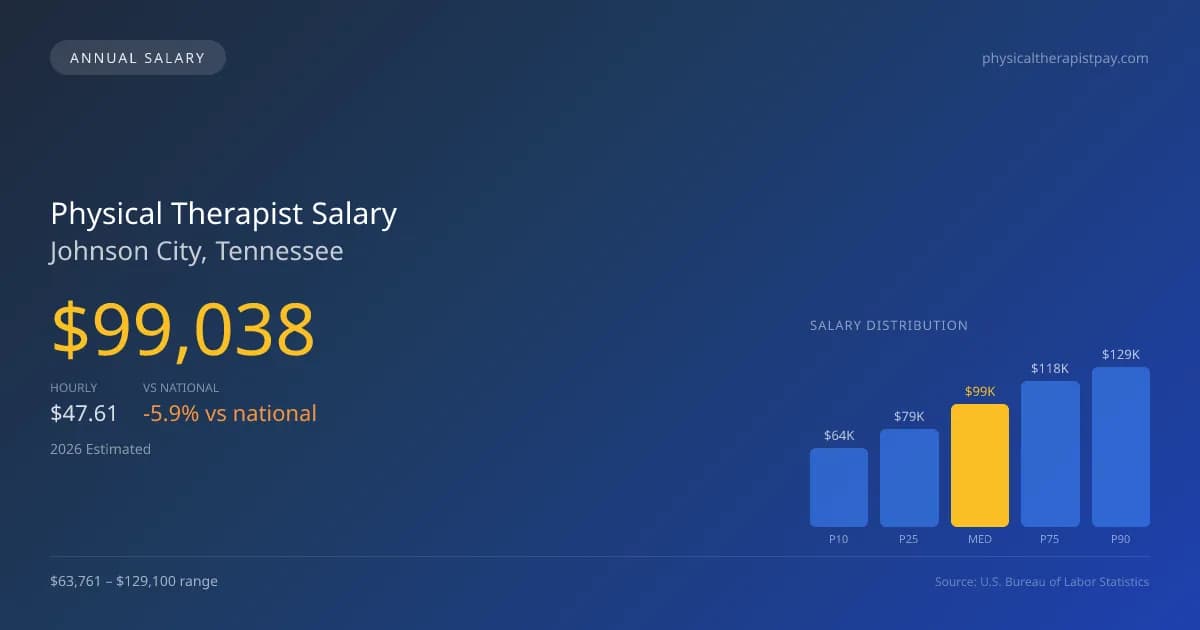
In 2026, physical therapists in Johnson City, TN, can anticipate a median annual salary of $99,038, which positions the region slightly below the national median of $105,288. This salary reflects a range that spans from $63,761 for the lower 10th percentile to $129,100 for the top 90th percentile. These figures, derived from the Bureau of Labor Statistics (BLS) data, highlight the diverse earning potential based on various factors within the sector. With the preeminent settings for employment often being outpatient clinics, the compensation can vary significantly depending on the type of facility. Typically, outpatient chains might offer lower base salaries compared to hospital systems that tend to reward specialized skills and higher productivity.
Salary Breakdown
| Percentile | Annual | Hourly |
|---|---|---|
| Entry Level (P10) | $63,761 | $30.66 |
| Lower Range (P25) | $79,027 | $37.99 |
| Median (P50)(typical) | $99,038 | $47.61 |
| Upper Range (P75) | $118,044 | $56.75 |
| Top Earners (P90) | $129,100 | $62.07 |
Median Salary Position
5.94% below the national average
2026 Salary Percentile Distribution in Johnson City
In Johnson City, TN, the physical therapist salary spread from the 10th to 90th percentile is $65,339 (2026 est.). At $99,038, the local median is 5.94% below the national median of $105,288.
Salary Calculator
At 40 hours/week in Johnson City: You'd be above the median
How Johnson City Physical Therapist Pay Compares
Johnson City median: $99,038/year (2026)
| Compared To | Median Salary | Johnson City Pays |
|---|---|---|
| Tennessee Average | $99,837 | -0.80% less |
| National Average | $105,288 | -5.94% less |
Physical Therapists in Johnson City, TN earn a median of $99,038 per year (2026 est.), which is 5.94% lower than the national median of $105,288 and 0.80% below the Tennessee state average of $99,837.
Cost-of-Living Adjusted Salary
Johnson City has a cost of living 12.07% below the national average, meaning your salary goes further here.
Adjusted salary = nominal × (100 / CoL index). CoL index: 100 = national average.
Johnson City, TN has a cost-of-living index of 87.928 (below the national average of 100). A physical therapist earning $99,038 nominally has purchasing power equivalent to $112,635 in an average-cost city — an effective 13.73% boost.
Compare Purchasing Power
Select a city to see how your salary compares after cost of living
Select a city above to compare purchasing power
2019 BLS Actual
$86,530
2025 BLS Actual
$96,660
2026 Current Est.
$99,038
2019–2027 Growth
+17.3%
Salary Trajectory for Physical Therapists in Johnson City (2019–2027)
2019–2025: actual BLS OEWS data for this metro area. 2026+: CAGR 2.46% projection.
| Year | Annual Salary | Status |
|---|---|---|
| 2019 | $86,530 | Actual |
| 2020 | $91,480 | Actual |
| 2021 | $92,690 | Actual |
| 2022 | $83,370 | Actual |
| 2023 | $93,130 | Actual |
| 2024 | $96,740 | Actual |
| 2025 | $96,660 | Actual |
| 2026(current) | $99,038 | Estimated |
| 2027 | $101,474 | Projected |
Based on 7 years of BLS OEWS data for the Johnson City metropolitan area, the median physical therapist salary grew 11.7% from $86,530 (2019) to $96,660 (2025). At a 2.46% compound annual growth rate, salaries are projected to reach $101,474 by 2027 — a total increase of $14,944 (17.27%) from 2019.
Note: Historical values (2019–2025) are actual BLS OEWS figures for the Johnson City metropolitan area, sourced from annual Occupational Employment and Wage Statistics surveys. 2026–2026 figures are current estimates, and 2027 values are projections, calculated using a 2.46% CAGR derived from 7-year BLS historical data. Actual salaries may vary based on employer, experience, certifications, and local market conditions.
Salary by Experience Level
| Experience | Estimated Salary Range |
|---|---|
| 0-2 years (New Graduate) | $63,761 – $79,027 |
| 3-5 years (Mid Career) | $79,027 – $99,038 |
| 5+ years (Experienced) | $99,038 – $118,044 |
| 10+ years (Top Earner) | $118,044 – $129,100 |
PT salary ranges estimated from BLS percentile data. Individual physical therapist compensation varies by employer, certifications, and specialization.
Physical Therapist Job Market in Johnson City
The local job market for physical therapists is relatively robust, with approximately 180 professionals currently employed in Johnson City. Notably, the area's cost of living is below the national average, with an index of 87.928, which can augment the purchasing power for those earning a physical therapist salary in Johnson City. Clinics that pay the most often include outpatient orthopedic practices or specialized facilities, where advancements through board certification like OCS or SCS can lead to salary stipends. Variations in pay can also arise from factors such as productivity expectations, clinic ownership opportunities, and the choice between cash-pay or insurance-based practice models. To maximize earning potential, therapists should seek out opportunities for specialization, align with high-performing clinics, and negotiate compensation linked to performance metrics, thereby adapting to trends in the evolving healthcare landscape.
More salary data for Johnson City, TN:
Frequently Asked Questions
How much do physical therapists make in Johnson City, TN in 2026?
Is Johnson City, TN a good place to work as a physical therapist?
Can physical therapists make $100K in Johnson City?
What is the cost-of-living adjusted physical therapist salary in Johnson City?
How much does a physical therapist make per hour in Johnson City?
Related Pages
Compare Salaries
Career Resources
Nearby Cities in Tennessee
Written by Alex Morgan, DPT
Career Analyst
Alex Morgan has over 10 years of experience in physical therapy. They specialize in orthopedic rehabilitation. Alex works in a private practice setting.
Methodology & Data Source
Salary figures on this page are 2026 projections based on the Bureau of Labor Statistics Occupational Employment and Wage Statistics (OEWS) survey, May 2026 release. The BLS reported a median annual salary of $96,660 for physical therapistsin the Johnson City metropolitan area. A 2.46% compound annual growth rate (CAGR), calculated from 6-year national BLS wage trends, was applied to project current 2026 compensation. Percentile ranges (P10–P90) represent the full salary distribution across experience levels and practice settings in this market.
Data Sources & Methodology
Source: BLS, OEWS, 7-year dataset (–). Per-city data from annual BLS metropolitan area surveys.
2026 figures are projected from 2025 BLS data using a compound annual growth rate (CAGR) of 2.46%, derived from historical BLS wage trends for physical therapists (SOC 29-1123).
Compiled and verified by Alex Morgan, DPT, a licensed physical therapist with 10+ years of clinical experience. · View source data at BLS.gov