Physical Therapist Salary in Allen, TX: $106,835 (2026)
Quick Answer:A full-time physical therapist in Allen, TX earns a median $106,835/year (≈ $51.36/hour) in nominal terms for 2026 — projected from BLS OEWS 2025 (SOC 29-1123). Once you factor in Allen's price level (4% below national, BEA RPP 96.0), that paycheck buys what $111,286 would nationally. Nominal pay sits 0.3% below the Texas state average.
Based on BLS state-level estimates · View source
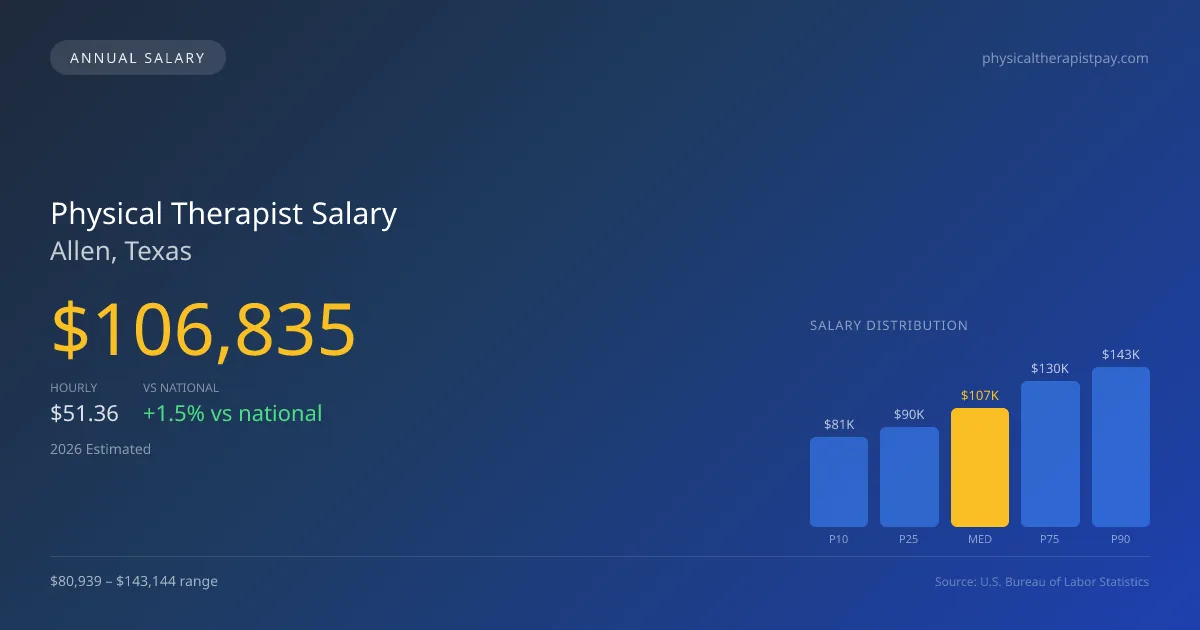
In 2026, physical therapists in Allen, Texas, are projected to earn a median annual salary of $106,835, which is slightly above the national median of $105,288. The salary spectrum ranges from $80,939 at the lower decile to $143,144 at the higher end, reflecting a diverse job market driven by varying practice settings. Outpatient chains, often more focused on volume and productivity, generally offer lower base salaries compared to hospital systems that can afford more robust compensation packages. Local estimates here are derived from 2025 BLS data and adjusted for regional price factors, highlighting the competitive nature of the healthcare job market in Allen, particularly in the outpatient therapy space which has dominated the field.
About the Allen Market
Salary estimated from Texas average ($100,000) adjusted for local cost of living.
Salary Breakdown
| Percentile | Annual | Hourly |
|---|---|---|
| Entry Level (P10) | $80,939 | $38.91 |
| Lower Range (P25) | $89,735 | $43.15 |
| Median (P50)(typical) | $106,835 | $51.36 |
| Upper Range (P75) | $130,206 | $62.60 |
| Top Earners (P90) | $143,144 | $68.82 |
Median Salary Position
1.47% above the national average
2026 Salary Percentile Distribution in Allen
In Allen, TX, the physical therapist salary spread from the 10th to 90th percentile is $62,205 (2026 est.). At $106,835, the local median is 1.47% above the national median of $105,288.
Salary Calculator
At 40 hours/week in Allen: You'd be in the lower-middle range
How Allen Physical Therapist Pay Compares
Allen median: $106,835/year (2026)
| Compared To | Median Salary | Allen Pays |
|---|---|---|
| Texas Average | $107,157 | -0.30% less |
| National Average | $105,288 | +1.47% more |
Physical Therapists in Allen, TX earn a median of $106,835 per year (2026 est.), which is 1.47% higher than the national median of $105,288 and 0.30% below the Texas state average of $107,157.
Cost-of-Living Adjusted Salary
Allen has a cost of living 4.00% below the national average, meaning your salary goes further here.
Adjusted salary = nominal × (100 / CoL index). CoL index: 100 = national average.
Allen, TX has a cost-of-living index of 96 (below the national average of 100). A physical therapist earning $106,835 nominally has purchasing power equivalent to $111,286 in an average-cost city — an effective 4.17% boost.
Compare Purchasing Power
Select a city to see how your salary compares after cost of living
Select a city above to compare purchasing power
2019 BLS Actual
$90,754
2025 BLS Actual
$104,270
2026 Current Est.
$106,835
2019–2027 Growth
+20.6%
Salary Trajectory for Physical Therapists in Allen (2019–2027)
2019–2025: actual BLS OEWS data for this metro area. 2026+: CAGR 2.46% projection.
| Year | Annual Salary | Status |
|---|---|---|
| 2019 | $90,754 | Actual |
| 2020 | $92,347 | Actual |
| 2021 | $97,025 | Actual |
| 2022 | $99,156 | Actual |
| 2023 | $101,175 | Actual |
| 2024 | $95,715 | Actual |
| 2025 | $104,270 | Actual |
| 2026(current) | $106,835 | Estimated |
| 2027 | $109,463 | Projected |
Based on 7 years of BLS OEWS data for the Allen metropolitan area, the median physical therapist salary grew 14.9% from $90,754 (2019) to $104,270 (2025). At a 2.46% compound annual growth rate, salaries are projected to reach $109,463 by 2027 — a total increase of $18,709 (20.62%) from 2019.
Note: Historical values (2019–2025) are actual BLS OEWS figures for the Allen metropolitan area, sourced from annual Occupational Employment and Wage Statistics surveys. 2026–2026 figures are current estimates, and 2027 values are projections, calculated using a 2.46% CAGR derived from 7-year BLS historical data. Actual salaries may vary based on employer, experience, certifications, and local market conditions.
Salary by Experience Level
| Experience | Estimated Salary Range |
|---|---|
| 0-2 years (New Graduate) | $80,939 – $89,735 |
| 3-5 years (Mid Career) | $89,735 – $106,835 |
| 5+ years (Experienced) | $106,835 – $130,206 |
| 10+ years (Top Earner) | $130,206 – $143,144 |
PT salary ranges estimated from BLS percentile data. Individual physical therapist compensation varies by employer, certifications, and specialization.
Physical Therapist Job Market in Allen
As of now, there are 19 physical therapists employed in Allen, contributing to a healthcare landscape that is sensitive to both the local economy and cost of living, indexed at 96, which is below the national average. This lower cost of living means that physical therapist pay in Allen, TX, can offer a decent purchasing power, but the real earnings potential varies significantly depending on the practice setting. Among the highest payers are hospital systems and specialized outpatient clinics, which prioritize advanced qualifications such as board certifications in Orthopedic Clinical Specialist (OCS) or Sports Clinical Specialist (SCS). Productivity expectations are notably high in outpatient settings, where bonuses and stipends for certifications can further boost earnings. Therefore, physical therapists looking to optimize their income in Allen should consider roles in higher-paying institutions, pursue additional certifications for potential stipends, and remain adaptable to productivity-driven practice models.
More salary data for Allen, TX:
Frequently Asked Questions
How much do physical therapists make in Allen, TX in 2026?
Is Allen, TX a good place to work as a physical therapist?
Can physical therapists make $100K in Allen?
What is the cost-of-living adjusted physical therapist salary in Allen?
How much does a physical therapist make per hour in Allen?
Related Pages
Compare Salaries
Career Resources
Nearby Cities in Texas
Written by Alex Morgan, DPT
Career Analyst
Alex Morgan has over 10 years of experience in physical therapy. They specialize in orthopedic rehabilitation. Alex works in a private practice setting.
Methodology & Data Source
Salary figures on this page are 2026 projections based on the Bureau of Labor Statistics Occupational Employment and Wage Statistics (OEWS) survey, May 2026 release. The BLS reported a median annual salary of $104,270 for physical therapistsin the Allen metropolitan area. A 2.46% compound annual growth rate (CAGR), calculated from 6-year national BLS wage trends, was applied to project current 2026 compensation. Percentile ranges (P10–P90) represent the full salary distribution across experience levels and practice settings in this market.
Data Sources & Methodology
Salary data for Allen is estimated from official BLS state-level occupational wage data (2025), adjusted for regional cost-of-living differences using BEA RPP (Regional Price Parities).
2026 figures are projected from 2025 BLS data using a compound annual growth rate (CAGR) of 2.46%, derived from historical BLS wage trends for physical therapists (SOC 29-1123).
Compiled and verified by Alex Morgan, DPT, a licensed physical therapist with 10+ years of clinical experience. · View source data at BLS.gov