Physical Therapist Salary in Beaumont, TX: $116,497 (2026)
Quick Answer:A full-time physical therapist in Beaumont, TX earns a median $116,497/year (≈ $56.00/hour) in nominal terms for 2026 — projected from BLS OEWS 2025 (SOC 29-1123). Once you factor in Beaumont's price level (10% below national, BEA RPP 90.0), that paycheck buys what $129,375 would nationally. Nominal pay sits 8.7% above the Texas state average.
Official BLS data · View source
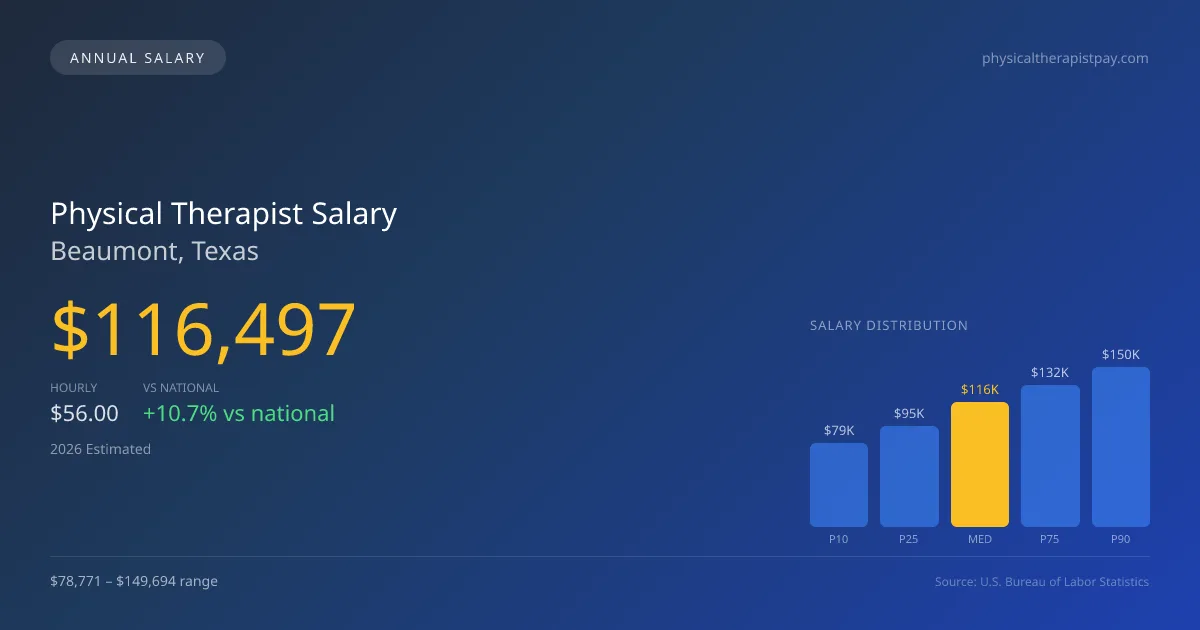
In Beaumont, Texas, physical therapists can anticipate a median annual salary of $116,497 in 2026, a figure that exceeds the national median of $105,288 by 10.65%. The salary range in this region varies significantly, with the lower 10% earning around $78,771, while the top 90% can command as much as $149,694. These figures, drawn from 2025 BLS OEWS data and projected to 2026, reflect a strong market that benefits from a trend towards cash-pay models, particularly among orthopedic specialists. This shift often elevates compensation levels for therapists focusing on sports and orthopedic care, effectively enhancing their earning potential in a competitive job market.
Salary Breakdown
| Percentile | Annual | Hourly |
|---|---|---|
| Entry Level (P10) | $78,771 | $37.87 |
| Lower Range (P25) | $94,765 | $45.55 |
| Median (P50)(typical) | $116,497 | $56.00 |
| Upper Range (P75) | $132,471 | $63.69 |
| Top Earners (P90) | $149,694 | $71.97 |
Median Salary Position
10.65% above the national average
2026 Salary Percentile Distribution in Beaumont
In Beaumont, TX, the physical therapist salary spread from the 10th to 90th percentile is $70,923 (2026 est.). At $116,497, the local median is 10.65% above the national median of $105,288.
Salary Calculator
At 40 hours/week in Beaumont: You'd be above the median
How Beaumont Physical Therapist Pay Compares
Beaumont median: $116,497/year (2026)
| Compared To | Median Salary | Beaumont Pays |
|---|---|---|
| Texas Average | $107,173 | +8.70% more |
| National Average | $105,288 | +10.65% more |
Physical Therapists in Beaumont, TX earn a median of $116,497 per year (2026 est.), which is 10.65% higher than the national median of $105,288 and 8.70% above the Texas state average of $107,173.
Cost-of-Living Adjusted Salary
Beaumont has a cost of living 9.95% below the national average, meaning your salary goes further here.
Adjusted salary = nominal × (100 / CoL index). CoL index: 100 = national average.
Beaumont, TX has a cost-of-living index of 90.046 (below the national average of 100). A physical therapist earning $116,497 nominally has purchasing power equivalent to $129,375 in an average-cost city — an effective 11.05% boost.
Compare Purchasing Power
Select a city to see how your salary compares after cost of living
Select a city above to compare purchasing power
2019 BLS Actual
$92,040
2025 BLS Actual
$113,700
2026 Current Est.
$116,497
2019–2027 Growth
+29.7%
Salary Trajectory for Physical Therapists in Beaumont (2019–2027)
2019–2025: actual BLS OEWS data for this metro area. 2026+: CAGR 2.46% projection.
| Year | Annual Salary | Status |
|---|---|---|
| 2019 | $92,040 | Actual |
| 2020 | $97,170 | Actual |
| 2021 | $101,180 | Actual |
| 2022 | $101,770 | Actual |
| 2023 | $107,940 | Actual |
| 2024 | $112,210 | Actual |
| 2025 | $113,700 | Actual |
| 2026(current) | $116,497 | Estimated |
| 2027 | $119,363 | Projected |
Based on 7 years of BLS OEWS data for the Beaumont metropolitan area, the median physical therapist salary grew 23.5% from $92,040 (2019) to $113,700 (2025). At a 2.46% compound annual growth rate, salaries are projected to reach $119,363 by 2027 — a total increase of $27,323 (29.69%) from 2019.
Note: Historical values (2019–2025) are actual BLS OEWS figures for the Beaumont metropolitan area, sourced from annual Occupational Employment and Wage Statistics surveys. 2026–2026 figures are current estimates, and 2027 values are projections, calculated using a 2.46% CAGR derived from 7-year BLS historical data. Actual salaries may vary based on employer, experience, certifications, and local market conditions.
Salary by Experience Level
| Experience | Estimated Salary Range |
|---|---|
| 0-2 years (New Graduate) | $78,771 – $94,765 |
| 3-5 years (Mid Career) | $94,765 – $116,497 |
| 5+ years (Experienced) | $116,497 – $132,471 |
| 10+ years (Top Earner) | $132,471 – $149,694 |
PT salary ranges estimated from BLS percentile data. Individual physical therapist compensation varies by employer, certifications, and specialization.
Physical Therapist Job Market in Beaumont
Beaumont's job market for physical therapists is robust, with about 250 professionals currently employed in the area. The cost of living index stands at 90.046, indicating that living expenses are below the national average, which positively impacts purchasing power for local therapists. Employers such as outpatient orthopedic clinics—whether private practices or chains like Athletico—tend to offer competitive salaries, especially when combined with productivity bonuses. The disparity in pay can largely be attributed to factors such as productivity expectations per visit, board certification stipends for advanced qualifications like OCS or SCS, and the distinction between cash-pay versus insurance-based practice models. Navigating this landscape effectively can enhance earnings; therapists might consider obtaining specialty certifications or engaging in practices with higher reimbursement rates to maximize their pay in Beaumont, TX.
More salary data for Beaumont, TX:
Frequently Asked Questions
How much do physical therapists make in Beaumont, TX in 2026?
Is Beaumont, TX a good place to work as a physical therapist?
Can physical therapists make $100K in Beaumont?
What is the cost-of-living adjusted physical therapist salary in Beaumont?
How much does a physical therapist make per hour in Beaumont?
Related Pages
Compare Salaries
Career Resources
Nearby Cities in Texas
Written by Alex Morgan, DPT
Career Analyst
Alex Morgan has over 10 years of experience in physical therapy. They specialize in orthopedic rehabilitation. Alex works in a private practice setting.
Methodology & Data Source
Salary figures on this page are 2026 projections based on the Bureau of Labor Statistics Occupational Employment and Wage Statistics (OEWS) survey, May 2026 release. The BLS reported a median annual salary of $113,700 for physical therapistsin the Beaumont metropolitan area. A 2.46% compound annual growth rate (CAGR), calculated from 6-year national BLS wage trends, was applied to project current 2026 compensation. Percentile ranges (P10–P90) represent the full salary distribution across experience levels and practice settings in this market.
Data Sources & Methodology
Source: BLS, OEWS, 7-year dataset (–). Per-city data from annual BLS metropolitan area surveys.
2026 figures are projected from 2025 BLS data using a compound annual growth rate (CAGR) of 2.46%, derived from historical BLS wage trends for physical therapists (SOC 29-1123).
Compiled and verified by Alex Morgan, DPT, a licensed physical therapist with 10+ years of clinical experience. · View source data at BLS.gov