Physical Therapist Salary in Bellevue, WA: $111,006 (2026)
Quick Answer:A full-time physical therapist in Bellevue, WA earns a median $111,006/year (≈ $53.37/hour) in nominal terms for 2026 — projected from BLS OEWS 2025 (SOC 29-1123). Once you factor in Bellevue's price level (7% above national, BEA RPP 107.4), that paycheck buys what $103,358 would nationally. Nominal pay sits 1.0% above the Washington state average.
Based on BLS state-level estimates · View source
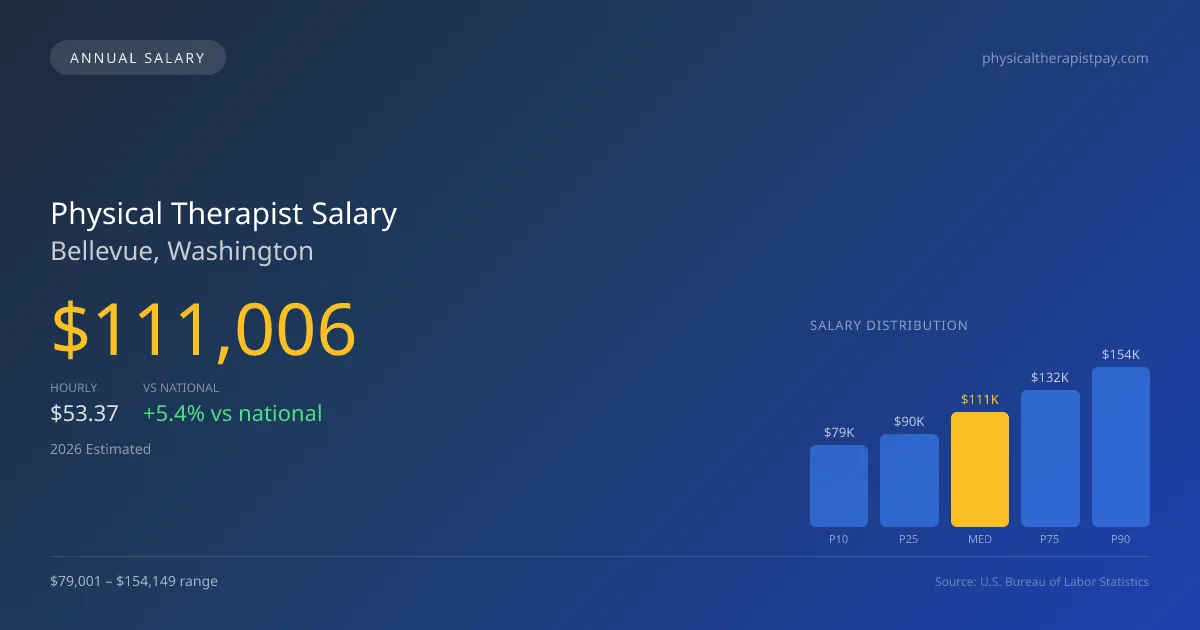
In 2026, physical therapists in Bellevue, Washington, are projected to earn a median annual salary of $111,006, slightly above the national median of $105,288. The salary landscape shows a range from $79,001 at the 10th percentile to $154,149 at the 90th. This data reflects adjustments based on regional price variations and productivity expectations that drive effective hourly compensation. Given the competitive healthcare environment, these figures indicate that Bellevue offers strong earning potential tailored to the demands of the field, aligning salaries with both experience and specific skill sets.
About the Bellevue Market
Salary estimated from Washington average ($99,000) adjusted for local cost of living.
Salary Breakdown
| Percentile | Annual | Hourly |
|---|---|---|
| Entry Level (P10) | $79,001 | $37.98 |
| Lower Range (P25) | $89,630 | $43.09 |
| Median (P50)(typical) | $111,006 | $53.37 |
| Upper Range (P75) | $131,523 | $63.23 |
| Top Earners (P90) | $154,149 | $74.11 |
Median Salary Position
5.43% above the national average
2026 Salary Percentile Distribution in Bellevue
In Bellevue, WA, the physical therapist salary spread from the 10th to 90th percentile is $75,148 (2026 est.). At $111,006, the local median is 5.43% above the national median of $105,288.
Salary Calculator
At 40 hours/week in Bellevue: You'd be in the lower-middle range
How Bellevue Physical Therapist Pay Compares
Bellevue median: $111,006/year (2026)
| Compared To | Median Salary | Bellevue Pays |
|---|---|---|
| Washington Average | $109,907 | +1.00% more |
| National Average | $105,288 | +5.43% more |
Physical Therapists in Bellevue, WA earn a median of $111,006 per year (2026 est.), which is 5.43% higher than the national median of $105,288 and 1.00% above the Washington state average of $109,907.
Cost-of-Living Adjusted Salary
Bellevue has a cost of living 7.40% above the national average.
Adjusted salary = nominal × (100 / CoL index). CoL index: 100 = national average.
Bellevue, WA has a cost-of-living index of 107.4 (above the national average of 100). While the nominal salary of $111,006 is competitive, the higher cost of living reduces purchasing power to an effective $103,358 — a 6.89% reduction.
Compare Purchasing Power
Select a city to see how your salary compares after cost of living
Select a city above to compare purchasing power
2019 BLS Actual
$94,298
2025 BLS Actual
$108,341
2026 Current Est.
$111,006
2019–2027 Growth
+20.6%
Salary Trajectory for Physical Therapists in Bellevue (2019–2027)
2019–2025: actual BLS OEWS data for this metro area. 2026+: CAGR 2.46% projection.
| Year | Annual Salary | Status |
|---|---|---|
| 2019 | $94,298 | Actual |
| 2020 | $95,953 | Actual |
| 2021 | $100,813 | Actual |
| 2022 | $103,027 | Actual |
| 2023 | $105,125 | Actual |
| 2024 | $108,442 | Actual |
| 2025 | $108,341 | Actual |
| 2026(current) | $111,006 | Estimated |
| 2027 | $113,737 | Projected |
Based on 7 years of BLS OEWS data for the Bellevue metropolitan area, the median physical therapist salary grew 14.9% from $94,298 (2019) to $108,341 (2025). At a 2.46% compound annual growth rate, salaries are projected to reach $113,737 by 2027 — a total increase of $19,439 (20.61%) from 2019.
Note: Historical values (2019–2025) are actual BLS OEWS figures for the Bellevue metropolitan area, sourced from annual Occupational Employment and Wage Statistics surveys. 2026–2026 figures are current estimates, and 2027 values are projections, calculated using a 2.46% CAGR derived from 7-year BLS historical data. Actual salaries may vary based on employer, experience, certifications, and local market conditions.
Salary by Experience Level
| Experience | Estimated Salary Range |
|---|---|
| 0-2 years (New Graduate) | $79,001 – $89,630 |
| 3-5 years (Mid Career) | $89,630 – $111,006 |
| 5+ years (Experienced) | $111,006 – $131,523 |
| 10+ years (Top Earner) | $131,523 – $154,149 |
PT salary ranges estimated from BLS percentile data. Individual physical therapist compensation varies by employer, certifications, and specialization.
Physical Therapist Job Market in Bellevue
The job market for physical therapists in Bellevue is relatively robust, with approximately 26 practitioners actively employed in the area. However, the cost of living index sits at 107.4, translating to higher living expenses that can impact take-home pay. Various employers in Bellevue, including outpatient orthopedic clinics and hospital rehabilitation facilities, dictate salary ranges. Those specializing in areas such as sports medicine or acquiring board certifications like OCS or SCS may experience significant pay premiums. Additionally, clinics operating on a cash-pay model can offer higher compensation compared to insurance-based practices. To capitalize on opportunities in this market, physical therapists should aim for productivity benchmarks while considering specialization to maximize their earning potential in Bellevue, WA.
More salary data for Bellevue, WA:
Frequently Asked Questions
How much do physical therapists make in Bellevue, WA in 2026?
Is Bellevue, WA a good place to work as a physical therapist?
Can physical therapists make $100K in Bellevue?
What is the cost-of-living adjusted physical therapist salary in Bellevue?
How much does a physical therapist make per hour in Bellevue?
Related Pages
Compare Salaries
Career Resources
Nearby Cities in Washington
Written by Alex Morgan, DPT
Career Analyst
Alex Morgan has over 10 years of experience in physical therapy. They specialize in orthopedic rehabilitation. Alex works in a private practice setting.
Methodology & Data Source
Salary figures on this page are 2026 projections based on the Bureau of Labor Statistics Occupational Employment and Wage Statistics (OEWS) survey, May 2026 release. The BLS reported a median annual salary of $108,341 for physical therapistsin the Bellevue metropolitan area. A 2.46% compound annual growth rate (CAGR), calculated from 6-year national BLS wage trends, was applied to project current 2026 compensation. Percentile ranges (P10–P90) represent the full salary distribution across experience levels and practice settings in this market.
Data Sources & Methodology
Salary data for Bellevue is estimated from official BLS state-level occupational wage data (2025), adjusted for regional cost-of-living differences using BEA RPP (Regional Price Parities).
2026 figures are projected from 2025 BLS data using a compound annual growth rate (CAGR) of 2.46%, derived from historical BLS wage trends for physical therapists (SOC 29-1123).
Compiled and verified by Alex Morgan, DPT, a licensed physical therapist with 10+ years of clinical experience. · View source data at BLS.gov