Senior Physical Therapist Salary in Bellevue, WA: $154,149 (2026)
Quick Answer:The top tier of physical therapists working in Bellevue, WA — those at or above the 90th percentile — pull in $154,149/year or more for 2026, based on BLS OEWS 2025 estimates for SOC 29-1123. Strip back Bellevue's price premium (BEA RPP 107.4, 7% above national) and that top-decile pay carries the same buying power as $143,528 in average-cost America. The 39% spread above city median typically rewards 7+ years of practice or specialty credentials.
Based on BLS state-level estimates · View source
In Bellevue, Washington, senior physical therapists can anticipate significant earning potential. Those at the pinnacle of their field, with advanced skills and experience, can command salaries reaching up to $154,149 in 2026, with the top 25% earning around $131,523. This prime earning capacity not only reflects the high demand for experienced professionals but also highlights a substantial gap from the median annual salary of $111,006. Achieving this top-tier pay often requires a combination of advanced certifications, such as board specialization in orthopedic or sports physical therapy, alongside a robust professional network. The competitive landscape in Bellevue pushes experienced therapists to consistently seek out advanced roles and opportunities, further enhancing their financial outcomes.
About the Bellevue Market
Salary estimated from Washington average ($99,000) adjusted for local cost of living.
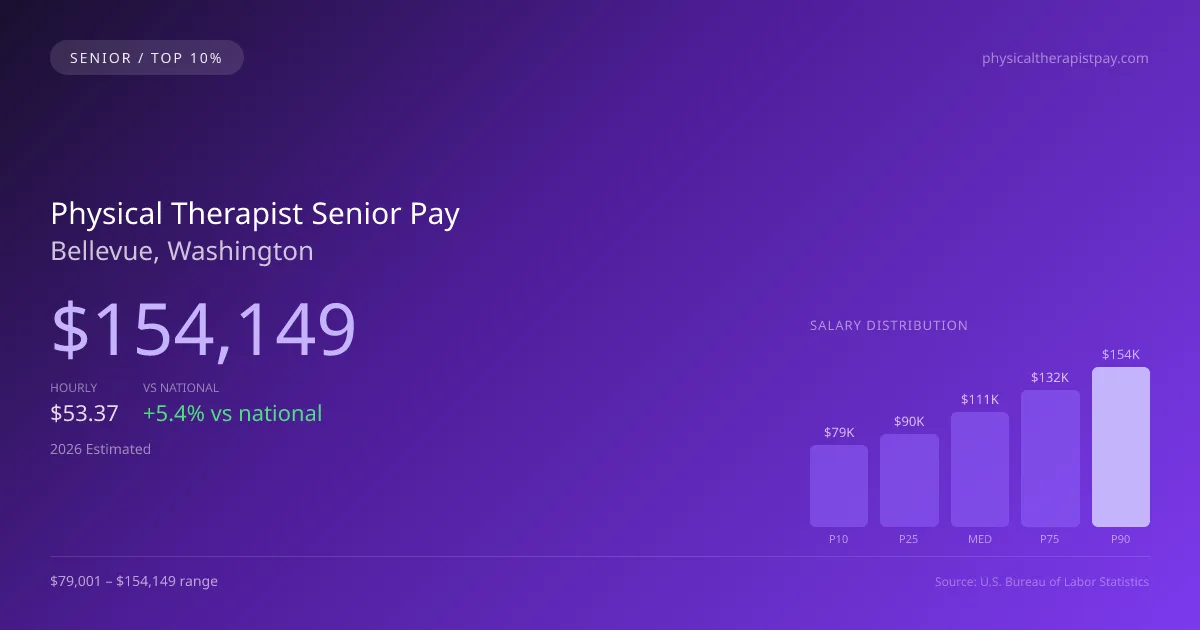
2026 Salary Percentile Distribution in Bellevue
Experienced physical therapists at the top of the pay scale in Bellevue earn between $131,523 and $154,149 per year (2026 est.). This $75,148 range from 10th to 90th percentile reflects significant earnings potential growth over a career. The Bellevue median of $111,006 sits 5.43% above the US median.
Top PT Salary Comparison
| Level | Bellevue | National |
|---|---|---|
| Median (P50) | $111,006 | $105,288 |
| 75th Percentile | $131,523 | $124,141 |
| 90th Percentile (Top 10%) | $154,149 | $138,464 |
In Bellevue, experienced physical therapists (P90) earn 38.87% more than the local median — reflecting the significant value of specialization and tenure in this market.
What Drives Top Physical Therapist Pay in Bellevue
Advanced Certifications in Washington
WA physical therapists with additional specialty certifications within the physical therapy field earn significantly above the $111,006 median. Expanded-scope credentials are increasingly valued by Bellevue employers.
Specialty Focus
Physical Therapists focusing on high-acuity or specialty areas within the physical therapy field in Bellevue command premium compensation, often reaching the $131,523–$154,149 range.
Large Health-System & Multi-Site Experience
Large hospital systems and multi-site employers in the Bellevue metro area often pay above-market rates for experienced physical therapists who demonstrate efficiency and leadership.
Employer Loyalty & Patient Relationships
Long-tenured physical therapists in Bellevue with established relationships have strong negotiating leverage. In this developing market, retention bonuses and annual raises are common for top performers.
Continuing Education & Leadership
Physical Therapists in Washington who pursue advanced degrees, mentor junior staff, or lead clinical education programs position themselves for the highest compensation tiers and management roles.
Physical Therapist Career & Wage Growth Path in Bellevue
Clinical Physical Therapist
0-5 yearsSenior/Lead Physical Therapist
5-10 yearsPhysical Therapist Department Manager
10+ yearsEducator / Specialty Leadership
AdvancedBellevue ranks #1 of 50 Washington cities for top earner physical therapist salary (90th percentile: $154,149).
Top 10% physical therapist compensation in Bellevue ($154,149) is 7.77% above the Washington average P90 ($143,039).
2019 BLS Actual
$138,870
2025 BLS Actual
$150,448
2026 Current Est.
$154,149
2019–2027 Growth
+13.7%
Salary Trajectory for Physical Therapists in Bellevue (2019–2027)
2019–2025: actual BLS OEWS data for this metro area. 2026+: CAGR 2.46% projection.
| Year | Annual Salary | Status |
|---|---|---|
| 2019 | $138,870 | Actual |
| 2020 | $141,141 | Actual |
| 2021 | $141,508 | Actual |
| 2022 | $143,423 | Actual |
| 2023 | $145,694 | Actual |
| 2024 | $150,203 | Actual |
| 2025 | $150,448 | Actual |
| 2026(current) | $154,149 | Estimated |
| 2027 | $157,941 | Projected |
Top-earning physical therapists (90th percentile) in Bellevue saw their compensation grow 8.3% from $138,870 in 2019 to $150,448 in 2025, based on 7 years of BLS OEWS data for this metropolitan area. At a 2.46% annual growth rate, senior-level pay is projected to reach $157,941 by 2027, reflecting continued demand for clinical expertise and expanded-function credentials.
Note: Historical values (2019–2025) are actual BLS OEWS figures for the Bellevue metropolitan area, sourced from annual Occupational Employment and Wage Statistics surveys. 2026–2026 figures are current estimates, and 2027 values are projections, calculated using a 2.46% CAGR derived from 7-year BLS historical data. Actual salaries may vary based on employer, experience, certifications, and local market conditions.
Maximizing Your Physical Therapist Earnings in Bellevue
Fulfilling the prerequisites for premier compensation often depends on focusing on high-demand specializations such as orthopedic (OCS), sports (SCS), and neurologic (NCS) physical therapy. The choice of employer can significantly influence compensation, with outpatient orthopedic clinics generally offering different pay scales compared to hospital inpatient settings or skilled nursing facility rehab. Moreover, leadership roles like clinic director or positions in APTA leadership provide pathways for elevated salaries and responsibilities. For therapists in Washington, obtaining additional credentials, such as a Doctor of Physical Therapy (DPT), can further augment their earning potential. Non-salary compensation is also crucial; the structure of productivity expectations, bonuses for certifications, and the choice between cash-pay versus insurance models can greatly impact total compensation. In the evolving field of physical therapy in Bellevue, staying abreast of these dynamics is essential for experienced professionals aiming for optimal income and career growth.
More salary data for Bellevue, WA:
Frequently Asked Questions
How much do experienced physical therapists make in Bellevue in 2026?
What drives higher physical therapist pay in Bellevue?
What certifications boost physical therapist salary in Bellevue?
Can experienced physical therapists make six figures in Bellevue?
How much does physical therapist salary increase over time in Bellevue?
Related Pages
Compare Salaries
Career Resources
Nearby Cities in Washington
Written by Alex Morgan, DPT
Career Analyst
Alex Morgan has over 10 years of experience in physical therapy. They specialize in orthopedic rehabilitation. Alex works in a private practice setting.
Methodology & Data Source
Top-earner salary figures on this page are 2026 projections derived from the Bureau of Labor Statistics Occupational Employment and Wage Statistics (OEWS) survey, May 2026 release. BLS reported a 90th percentile salary of $150,448 for physical therapists in the Bellevue metro area. A 2.46% compound annual growth rate (CAGR), calculated from 6-year national BLS wage trends, was applied to project current 2026 senior-level compensation. Individual earnings depend on certifications, specialization, practice type, and years of clinical experience.
Data Sources & Methodology
Salary data for Bellevue is estimated from official BLS state-level occupational wage data (2025), adjusted for regional cost-of-living differences using BEA RPP (Regional Price Parities).
2026 figures are projected from 2025 BLS data using a compound annual growth rate (CAGR) of 2.46%, derived from historical BLS wage trends for physical therapists (SOC 29-1123).
Compiled and verified by Alex Morgan, DPT, a licensed physical therapist with 10+ years of clinical experience. · View source data at BLS.gov