Senior Physical Therapist Salary in Norfolk, VA: $144,034 (2026)
Quick Answer:The top tier of physical therapists working in Norfolk, VA — those at or above the 90th percentile — pull in $144,034/year or more for 2026, based on BLS OEWS 2025 estimates for SOC 29-1123. Strip back Norfolk's price premium (BEA RPP 103.2, 3% above national) and that top-decile pay carries the same buying power as $139,568 in average-cost America. The 37% spread above city median typically rewards 7+ years of practice or specialty credentials.
Based on BLS state-level estimates · View source
Norfolk, Virginia, offers an attractive financial landscape for experienced physical therapists, where top-earning professionals can secure impressive salaries, with projections indicating a maximum potential of $144,034 in 2026. The median annual salary for senior physical therapists in this region is estimated at $104,863, highlighting a significant experience premium that underscores the value of advanced skills. The gap between median earnings and the upper echelon of pay suggests that reaching top-tier compensation involves not only accumulated years of practice but also specialized training and credentials. Aspiring to achieve the highest compensation levels requires dedication to continuous professional development and often a focus on areas that are in high demand within the healthcare market, reflecting both individual expertise and the evolving needs of the patient population.
About the Norfolk Market
Salary estimated from Virginia average ($95,000) adjusted for local cost of living.
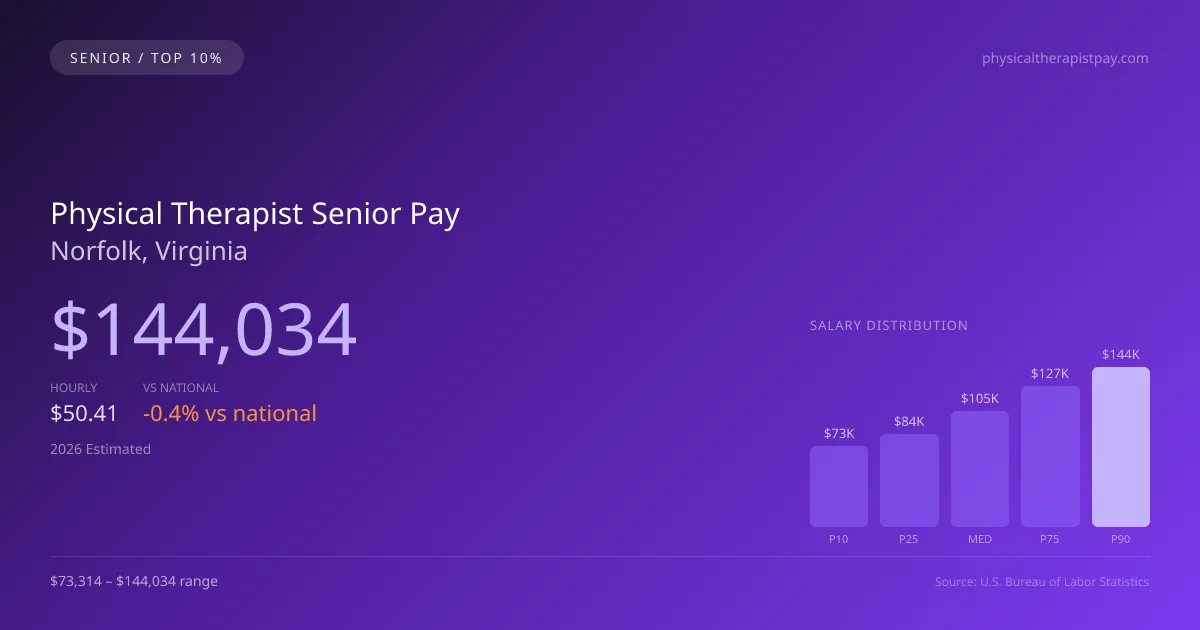
2026 Salary Percentile Distribution in Norfolk
Experienced physical therapists at the top of the pay scale in Norfolk earn between $126,718 and $144,034 per year (2026 est.). This $70,720 range from 10th to 90th percentile reflects significant earnings potential growth over a career. The Norfolk median of $104,863 sits 0.4% below the US median.
Top PT Salary Comparison
| Level | Norfolk | National |
|---|---|---|
| Median (P50) | $104,863 | $105,288 |
| 75th Percentile | $126,718 | $124,141 |
| 90th Percentile (Top 10%) | $144,034 | $138,464 |
In Norfolk, experienced physical therapists (P90) earn 37.35% more than the local median — reflecting the significant value of specialization and tenure in this market.
What Drives Top Physical Therapist Pay in Norfolk
Advanced Certifications in Virginia
VA physical therapists with additional specialty certifications within the physical therapy field earn significantly above the $104,863 median. Expanded-scope credentials are increasingly valued by Norfolk employers.
Specialty Focus
Physical Therapists focusing on high-acuity or specialty areas within the physical therapy field in Norfolk command premium compensation, often reaching the $126,718–$144,034 range.
Large Health-System & Multi-Site Experience
Large hospital systems and multi-site employers in the Norfolk metro area often pay above-market rates for experienced physical therapists who demonstrate efficiency and leadership.
Employer Loyalty & Patient Relationships
Long-tenured physical therapists in Norfolk with established relationships have strong negotiating leverage. In this developing market, retention bonuses and annual raises are common for top performers.
Continuing Education & Leadership
Physical Therapists in Virginia who pursue advanced degrees, mentor junior staff, or lead clinical education programs position themselves for the highest compensation tiers and management roles.
Physical Therapist Career & Wage Growth Path in Norfolk
Clinical Physical Therapist
0-5 yearsSenior/Lead Physical Therapist
5-10 yearsPhysical Therapist Department Manager
10+ yearsEducator / Specialty Leadership
AdvancedNorfolk ranks #3 of 42 Virginia cities for top earner physical therapist salary (90th percentile: $144,034).
Top 10% physical therapist compensation in Norfolk ($144,034) is 10.22% above the Virginia average P90 ($130,676).
2019 BLS Actual
$129,758
2025 BLS Actual
$140,576
2026 Current Est.
$144,034
2019–2027 Growth
+13.7%
Salary Trajectory for Physical Therapists in Norfolk (2019–2027)
2019–2025: actual BLS OEWS data for this metro area. 2026+: CAGR 2.46% projection.
| Year | Annual Salary | Status |
|---|---|---|
| 2019 | $129,758 | Actual |
| 2020 | $131,880 | Actual |
| 2021 | $132,223 | Actual |
| 2022 | $134,012 | Actual |
| 2023 | $136,134 | Actual |
| 2024 | $140,398 | Actual |
| 2025 | $140,576 | Actual |
| 2026(current) | $144,034 | Estimated |
| 2027 | $147,577 | Projected |
Top-earning physical therapists (90th percentile) in Norfolk saw their compensation grow 8.3% from $129,758 in 2019 to $140,576 in 2025, based on 7 years of BLS OEWS data for this metropolitan area. At a 2.46% annual growth rate, senior-level pay is projected to reach $147,577 by 2027, reflecting continued demand for clinical expertise and expanded-function credentials.
Note: Historical values (2019–2025) are actual BLS OEWS figures for the Norfolk metropolitan area, sourced from annual Occupational Employment and Wage Statistics surveys. 2026–2026 figures are current estimates, and 2027 values are projections, calculated using a 2.46% CAGR derived from 7-year BLS historical data. Actual salaries may vary based on employer, experience, certifications, and local market conditions.
Maximizing Your Physical Therapist Earnings in Norfolk
Elevated compensation in Norfolk correlates strongly with specialized training in areas such as orthopedic and sports therapy, where designations like OCS and SCS can command higher salaries. Employers vary significantly in compensation, with hospital systems often offering more robust pay structures compared to outpatient clinics like those operated by Athletico or ATI, yet the latter may provide productivity incentives that enhance earnings through efficiency. Leadership roles, such as becoming a clinic director or heading up a residency program, further enhance earning potential, illustrating the pathways available for career advancement. Additional qualifications, such as completing a Doctor of Physical Therapy (DPT) program and obtaining board certification, can provide substantial leverage in negotiations. Non-salary compensation can also be significant, especially when factoring in performance-based bonuses and equity options for clinic ownership, making understanding the local market dynamics crucial for maximizing senior physical therapist pay in VA.
More salary data for Norfolk, VA:
Frequently Asked Questions
How much do experienced physical therapists make in Norfolk in 2026?
What drives higher physical therapist pay in Norfolk?
What certifications boost physical therapist salary in Norfolk?
Can experienced physical therapists make six figures in Norfolk?
How much does physical therapist salary increase over time in Norfolk?
Related Pages
Compare Salaries
Career Resources
Nearby Cities in Virginia
Written by Alex Morgan, DPT
Career Analyst
Alex Morgan has over 10 years of experience in physical therapy. They specialize in orthopedic rehabilitation. Alex works in a private practice setting.
Methodology & Data Source
Top-earner salary figures on this page are 2026 projections derived from the Bureau of Labor Statistics Occupational Employment and Wage Statistics (OEWS) survey, May 2026 release. BLS reported a 90th percentile salary of $140,576 for physical therapists in the Norfolk metro area. A 2.46% compound annual growth rate (CAGR), calculated from 6-year national BLS wage trends, was applied to project current 2026 senior-level compensation. Individual earnings depend on certifications, specialization, practice type, and years of clinical experience.
Data Sources & Methodology
Salary data for Norfolk is estimated from official BLS state-level occupational wage data (2025), adjusted for regional cost-of-living differences using BEA RPP (Regional Price Parities).
2026 figures are projected from 2025 BLS data using a compound annual growth rate (CAGR) of 2.46%, derived from historical BLS wage trends for physical therapists (SOC 29-1123).
Compiled and verified by Alex Morgan, DPT, a licensed physical therapist with 10+ years of clinical experience. · View source data at BLS.gov