Senior Physical Therapist Salary in Reston, VA: $134,908 (2026)
Quick Answer:The top tier of physical therapists working in Reston, VA — those at or above the 90th percentile — pull in $134,908/year or more for 2026, based on BLS OEWS 2025 estimates for SOC 29-1123. Strip back Reston's price premium (BEA RPP 103.2, 3% above national) and that top-decile pay carries the same buying power as $130,725 in average-cost America. The 31% spread above city median typically rewards 7+ years of practice or specialty credentials.
Based on BLS state-level estimates · View source
In Reston, Virginia, experienced physical therapists can look forward to a competitive compensation landscape, particularly for those reaching the top tiers of the profession. With an annual salary potential of up to $134,908 for the highest earners, it's evident that substantial rewards accompany expertise and experience. The projected median annual salary of $102,602 represents a solid foundation, but the real financial incentives lie in the advanced skills and specialization that can elevate practitioners to the upper echelons of senior physical therapist pay in VA. Achieving this level typically requires not only extensive clinical experience but also advanced credentials and proven clinical outcomes, making it essential for therapists to continually refine their expertise and adapt to the evolving healthcare environment.
About the Reston Market
Salary estimated from Virginia average ($95,000) adjusted for local cost of living.
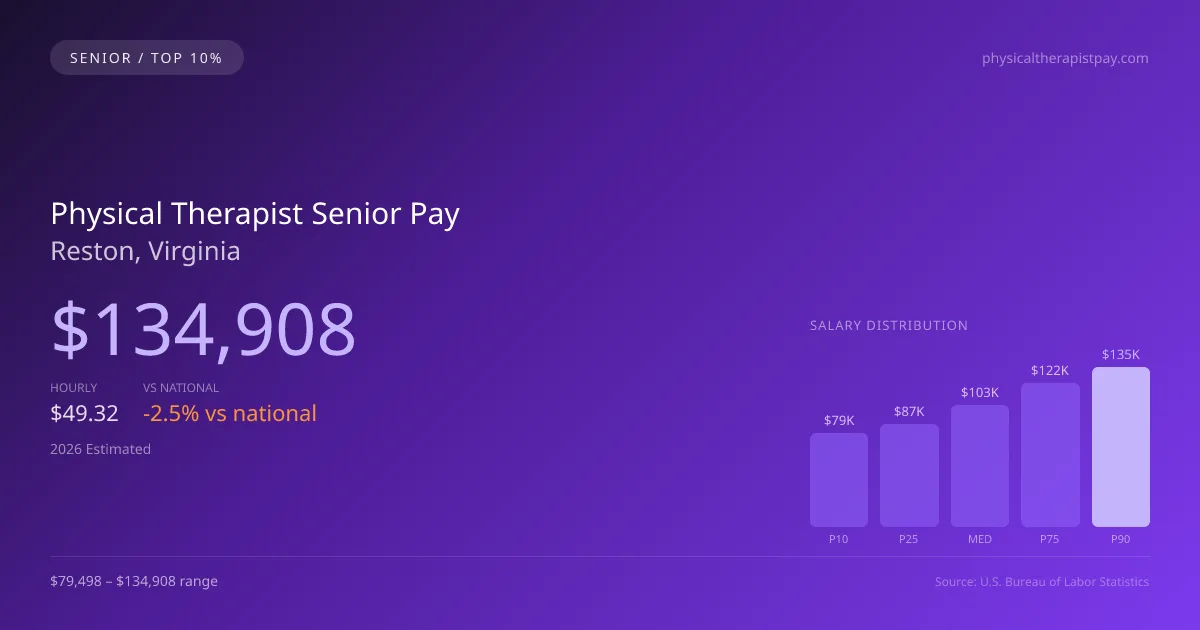
2026 Salary Percentile Distribution in Reston
Experienced physical therapists at the top of the pay scale in Reston earn between $121,728 and $134,908 per year (2026 est.). This $55,410 range from 10th to 90th percentile reflects significant earnings potential growth over a career. The Reston median of $102,602 sits 2.55% below the US median.
Top PT Salary Comparison
| Level | Reston | National |
|---|---|---|
| Median (P50) | $102,602 | $105,288 |
| 75th Percentile | $121,728 | $124,141 |
| 90th Percentile (Top 10%) | $134,908 | $138,464 |
In Reston, experienced physical therapists (P90) earn 31.49% more than the local median — reflecting the significant value of specialization and tenure in this market.
What Drives Top Physical Therapist Pay in Reston
Advanced Certifications in Virginia
VA physical therapists with additional specialty certifications within the physical therapy field earn significantly above the $102,602 median. Expanded-scope credentials are increasingly valued by Reston employers.
Specialty Focus
Physical Therapists focusing on high-acuity or specialty areas within the physical therapy field in Reston command premium compensation, often reaching the $121,728–$134,908 range.
Large Health-System & Multi-Site Experience
Large hospital systems and multi-site employers in the Reston metro area often pay above-market rates for experienced physical therapists who demonstrate efficiency and leadership.
Employer Loyalty & Patient Relationships
Long-tenured physical therapists in Reston with established relationships have strong negotiating leverage. In this developing market, retention bonuses and annual raises are common for top performers.
Continuing Education & Leadership
Physical Therapists in Virginia who pursue advanced degrees, mentor junior staff, or lead clinical education programs position themselves for the highest compensation tiers and management roles.
Physical Therapist Career & Wage Growth Path in Reston
Clinical Physical Therapist
0-5 yearsSenior/Lead Physical Therapist
5-10 yearsPhysical Therapist Department Manager
10+ yearsEducator / Specialty Leadership
AdvancedReston ranks #11 of 42 Virginia cities for top earner physical therapist salary (90th percentile: $134,908).
Top 10% physical therapist compensation in Reston ($134,908) is 3.24% above the Virginia average P90 ($130,676).
2019 BLS Actual
$121,536
2025 BLS Actual
$131,669
2026 Current Est.
$134,908
2019–2027 Growth
+13.7%
Salary Trajectory for Physical Therapists in Reston (2019–2027)
2019–2025: actual BLS OEWS data for this metro area. 2026+: CAGR 2.46% projection.
| Year | Annual Salary | Status |
|---|---|---|
| 2019 | $121,536 | Actual |
| 2020 | $123,524 | Actual |
| 2021 | $123,845 | Actual |
| 2022 | $125,521 | Actual |
| 2023 | $127,509 | Actual |
| 2024 | $125,729 | Actual |
| 2025 | $131,669 | Actual |
| 2026(current) | $134,908 | Estimated |
| 2027 | $138,227 | Projected |
Top-earning physical therapists (90th percentile) in Reston saw their compensation grow 8.3% from $121,536 in 2019 to $131,669 in 2025, based on 7 years of BLS OEWS data for this metropolitan area. At a 2.46% annual growth rate, senior-level pay is projected to reach $138,227 by 2027, reflecting continued demand for clinical expertise and expanded-function credentials.
Note: Historical values (2019–2025) are actual BLS OEWS figures for the Reston metropolitan area, sourced from annual Occupational Employment and Wage Statistics surveys. 2026–2026 figures are current estimates, and 2027 values are projections, calculated using a 2.46% CAGR derived from 7-year BLS historical data. Actual salaries may vary based on employer, experience, certifications, and local market conditions.
Maximizing Your Physical Therapist Earnings in Reston
From orthopedics to sports therapy, various specialized fields command premium pay, offering senior physical therapists in Reston the chance to significantly increase their earning power. Areas such as neurologic and pediatric therapy, for instance, can set experienced professionals apart in a competitive job market. Compensation structures differ substantially depending on the employer type; outpatient orthopedic clinics might provide lucrative productivity bonuses, whereas hospital inpatient rehab settings may offer steadier salaries but less flexibility. Additionally, leadership roles, such as clinic directors or faculty positions in DPT programs, become realistic goals for those looking to advance their careers, further enhancing their pay potential. Obtaining board certifications like OCS or SCS can also contribute to a stronger salary package, particularly in a state like Virginia, where advanced qualifications are highly valued. Non-salary factors, including clinic ownership equity or participation in cash-pay models, can further enrich overall compensation, making the landscape for experienced physical therapist salaries in Reston both diverse and rewarding.
More salary data for Reston, VA:
Frequently Asked Questions
How much do experienced physical therapists make in Reston in 2026?
What drives higher physical therapist pay in Reston?
What certifications boost physical therapist salary in Reston?
Can experienced physical therapists make six figures in Reston?
How much does physical therapist salary increase over time in Reston?
Related Pages
Compare Salaries
Career Resources
Nearby Cities in Virginia
Written by Alex Morgan, DPT
Career Analyst
Alex Morgan has over 10 years of experience in physical therapy. They specialize in orthopedic rehabilitation. Alex works in a private practice setting.
Methodology & Data Source
Top-earner salary figures on this page are 2026 projections derived from the Bureau of Labor Statistics Occupational Employment and Wage Statistics (OEWS) survey, May 2026 release. BLS reported a 90th percentile salary of $131,669 for physical therapists in the Reston metro area. A 2.46% compound annual growth rate (CAGR), calculated from 6-year national BLS wage trends, was applied to project current 2026 senior-level compensation. Individual earnings depend on certifications, specialization, practice type, and years of clinical experience.
Data Sources & Methodology
Salary data for Reston is estimated from official BLS state-level occupational wage data (2025), adjusted for regional cost-of-living differences using BEA RPP (Regional Price Parities).
2026 figures are projected from 2025 BLS data using a compound annual growth rate (CAGR) of 2.46%, derived from historical BLS wage trends for physical therapists (SOC 29-1123).
Compiled and verified by Alex Morgan, DPT, a licensed physical therapist with 10+ years of clinical experience. · View source data at BLS.gov