Senior Physical Therapist Salary in Springfield, VA: $129,980 (2026)
Quick Answer:The top tier of physical therapists working in Springfield, VA — those at or above the 90th percentile — pull in $129,980/year or more for 2026, based on BLS OEWS 2025 estimates for SOC 29-1123. Strip back Springfield's price premium (BEA RPP 103.2, 3% above national) and that top-decile pay carries the same buying power as $125,950 in average-cost America. The 29% spread above city median typically rewards 7+ years of practice or specialty credentials.
Based on BLS state-level estimates · View source
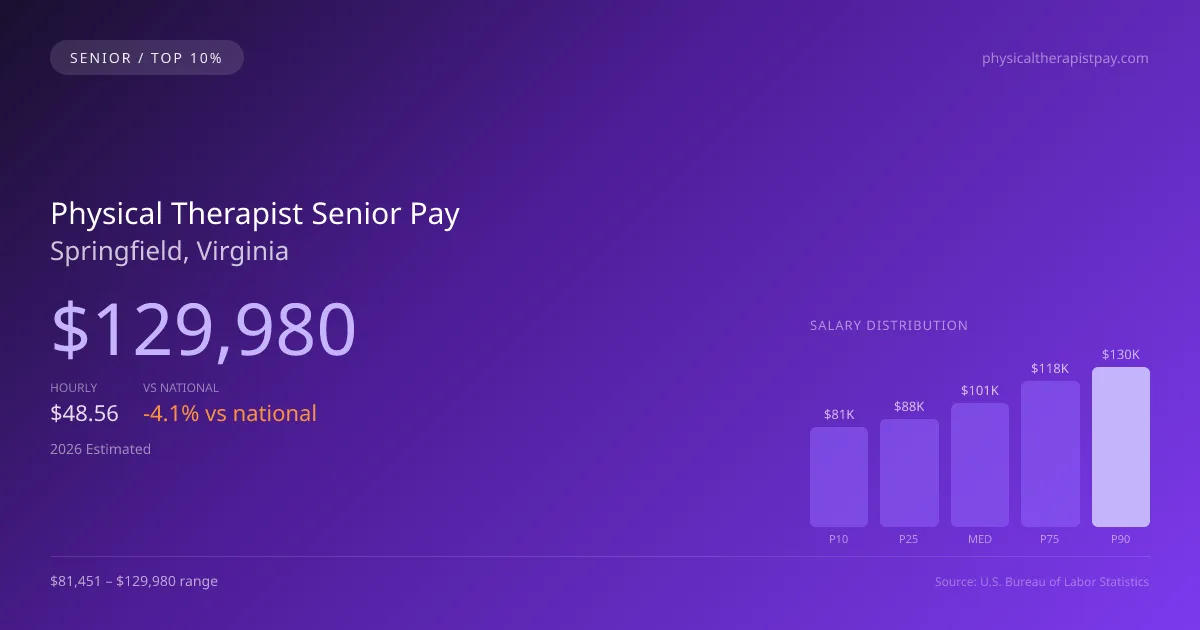
In 2026, senior physical therapists in Springfield, Virginia, can anticipate an annual salary ranging from $81,451 to a notable $129,980 for the top earners in the profession. The median predicted salary of $101,002 indicates a significant potential for those who achieve specialized expertise and experience. For seasoned professionals, those positioned at the 75th percentile can earn around $118,419, emphasizing the substantial income gap that exists between the general median and top-tier salaries. The journey to attain such esteemed financial standing typically requires at least seven years of experience, often paired with advanced credentials like board certifications in specialties such as orthopedic clinical specialist (OCS) or sports clinical specialist (SCS), as well as possibilities for leadership roles within diverse practice settings.
About the Springfield Market
Salary estimated from Virginia average ($95,000) adjusted for local cost of living.
2026 Salary Percentile Distribution in Springfield
Experienced physical therapists at the top of the pay scale in Springfield earn between $118,419 and $129,980 per year (2026 est.). This $48,529 range from 10th to 90th percentile reflects significant earnings potential growth over a career. The Springfield median of $101,002 sits 4.07% below the US median.
Top PT Salary Comparison
| Level | Springfield | National |
|---|---|---|
| Median (P50) | $101,002 | $105,288 |
| 75th Percentile | $118,419 | $124,141 |
| 90th Percentile (Top 10%) | $129,980 | $138,464 |
In Springfield, experienced physical therapists (P90) earn 28.69% more than the local median — reflecting the significant value of specialization and tenure in this market.
What Drives Top Physical Therapist Pay in Springfield
Advanced Certifications in Virginia
VA physical therapists with additional specialty certifications within the physical therapy field earn significantly above the $101,002 median. Expanded-scope credentials are increasingly valued by Springfield employers.
Specialty Focus
Physical Therapists focusing on high-acuity or specialty areas within the physical therapy field in Springfield command premium compensation, often reaching the $118,419–$129,980 range.
Large Health-System & Multi-Site Experience
Large hospital systems and multi-site employers in the Springfield metro area often pay above-market rates for experienced physical therapists who demonstrate efficiency and leadership.
Employer Loyalty & Patient Relationships
Long-tenured physical therapists in Springfield with established relationships have strong negotiating leverage. In this developing market, retention bonuses and annual raises are common for top performers.
Continuing Education & Leadership
Physical Therapists in Virginia who pursue advanced degrees, mentor junior staff, or lead clinical education programs position themselves for the highest compensation tiers and management roles.
Physical Therapist Career & Wage Growth Path in Springfield
Clinical Physical Therapist
0-5 yearsSenior/Lead Physical Therapist
5-10 yearsPhysical Therapist Department Manager
10+ yearsEducator / Specialty Leadership
AdvancedSpringfield ranks #22 of 42 Virginia cities for top earner physical therapist salary (90th percentile: $129,980).
Top 10% physical therapist compensation in Springfield ($129,980) is 0.53% below the Virginia average P90 ($130,676).
2019 BLS Actual
$117,096
2025 BLS Actual
$126,859
2026 Current Est.
$129,980
2019–2027 Growth
+13.7%
Salary Trajectory for Physical Therapists in Springfield (2019–2027)
2019–2025: actual BLS OEWS data for this metro area. 2026+: CAGR 2.46% projection.
| Year | Annual Salary | Status |
|---|---|---|
| 2019 | $117,096 | Actual |
| 2020 | $119,011 | Actual |
| 2021 | $119,321 | Actual |
| 2022 | $120,936 | Actual |
| 2023 | $122,851 | Actual |
| 2024 | $121,139 | Actual |
| 2025 | $126,859 | Actual |
| 2026(current) | $129,980 | Estimated |
| 2027 | $133,177 | Projected |
Top-earning physical therapists (90th percentile) in Springfield saw their compensation grow 8.3% from $117,096 in 2019 to $126,859 in 2025, based on 7 years of BLS OEWS data for this metropolitan area. At a 2.46% annual growth rate, senior-level pay is projected to reach $133,177 by 2027, reflecting continued demand for clinical expertise and expanded-function credentials.
Note: Historical values (2019–2025) are actual BLS OEWS figures for the Springfield metropolitan area, sourced from annual Occupational Employment and Wage Statistics surveys. 2026–2026 figures are current estimates, and 2027 values are projections, calculated using a 2.46% CAGR derived from 7-year BLS historical data. Actual salaries may vary based on employer, experience, certifications, and local market conditions.
Maximizing Your Physical Therapist Earnings in Springfield
Compensation for experienced physical therapists in Springfield can greatly vary based on specialization and employment type, influencing the senior physical therapist pay in VA. Specializations such as neurology, pediatrics, cardiopulmonary, and geriatric care are highly sought after, often commanding premium pay rates. For instance, therapists working in outpatient orthopedic clinics may enjoy higher pay due to the emphasis on productivity, while those in skilled nursing facilities or hospitals might benefit from more stable hours but potentially lower earnings. Career advancement opportunities are also prevalent, including leadership positions like clinic director or faculty roles within physical therapy programs. Advanced qualifications, such as a Doctor of Physical Therapy (DPT) degree or residency completion, can further enhance earning potential. In addition to salary, factors like productivity expectations, ownership stakes, and practice models can significantly impact overall compensation in this dynamic field.
More salary data for Springfield, VA:
Frequently Asked Questions
How much do experienced physical therapists make in Springfield in 2026?
What drives higher physical therapist pay in Springfield?
What certifications boost physical therapist salary in Springfield?
Can experienced physical therapists make six figures in Springfield?
How much does physical therapist salary increase over time in Springfield?
Related Pages
Compare Salaries
Career Resources
Nearby Cities in Virginia
Written by Alex Morgan, DPT
Career Analyst
Alex Morgan has over 10 years of experience in physical therapy. They specialize in orthopedic rehabilitation. Alex works in a private practice setting.
Methodology & Data Source
Top-earner salary figures on this page are 2026 projections derived from the Bureau of Labor Statistics Occupational Employment and Wage Statistics (OEWS) survey, May 2026 release. BLS reported a 90th percentile salary of $126,859 for physical therapists in the Springfield metro area. A 2.46% compound annual growth rate (CAGR), calculated from 6-year national BLS wage trends, was applied to project current 2026 senior-level compensation. Individual earnings depend on certifications, specialization, practice type, and years of clinical experience.
Data Sources & Methodology
Salary data for Springfield is estimated from official BLS state-level occupational wage data (2025), adjusted for regional cost-of-living differences using BEA RPP (Regional Price Parities).
2026 figures are projected from 2025 BLS data using a compound annual growth rate (CAGR) of 2.46%, derived from historical BLS wage trends for physical therapists (SOC 29-1123).
Compiled and verified by Alex Morgan, DPT, a licensed physical therapist with 10+ years of clinical experience. · View source data at BLS.gov