Physical Therapist Hourly Pay in Bellingham, WA: $47.51 (2026)
Quick Answer:Hourly pay for a physical therapist working in Bellingham, WA runs $47.51 at the median for 2026 — annualizing to $98,823 at a standard 2,080-hour year. Figures projected from BLS OEWS 2025 (SOC 29-1123). Weighted against Bellingham's regional price level (BEA RPP 103.3, 3% above national), each hour of work buys what $45.98 nationally would. A 24-hour part-time schedule grosses $59,293 per year.
Official BLS data · View source
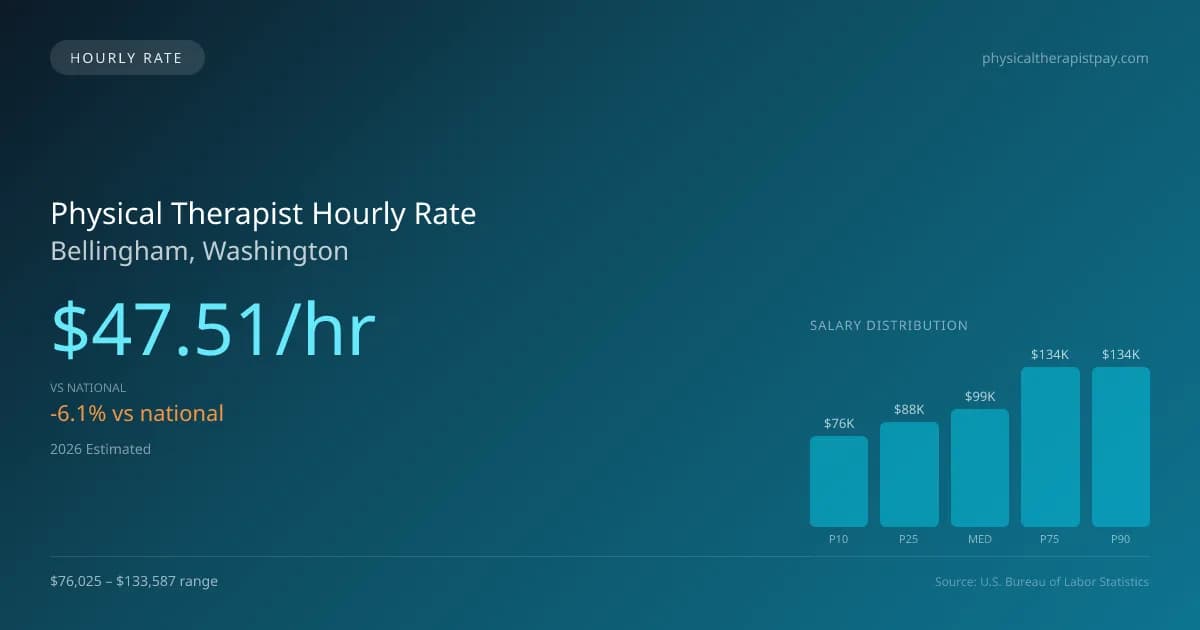
In Bellingham, Washington, the physical therapist hourly pay is projected to be $47.51 in 2026. This figure is slightly below the national hourly median of $50.62. For those working part-time, such as three days a week, this rate allows for a viable income in settings like outpatient clinics, skilled nursing facilities, and home health visits. The hourly compensation can vary significantly, ranging from $36.56 for entry-level positions to $64.22 for top earners in the field. Such variations emphasize the diverse career paths available for physical therapists in Bellingham, where the cost of living index indicates expenses that are generally above the national average.
Physical Therapist Hourly Wage Breakdown
| Percentile | Hourly Rate | Per 8hr Shift |
|---|---|---|
| Entry Level (P10) | $36.56 | $292.46 |
| Lower Range (P25) | $42.21 | $337.71 |
| Median (P50) | $47.51 | $380.09 |
| Upper Range (P75) | $64.22 | $513.78 |
| Top Earners (P90) | $64.22 | $513.78 |
Estimated Annual Income by Work Schedule in Bellingham
Based on $47.51/hr median hourly rate · 2026 est.
At $47.51/hr, a physical therapist working full-time (40 hr/wk) in Bellingham, WA can expect to earn approximately $98,822 per year (2026 est.). Part-time hygienists working 24 hours per week would earn around $57,013. With a cost-of-living index of 103.33 (above the national average), these earnings may be offset by higher expenses in Bellingham.
Hourly Rate Calculator
Schedule Comparison in Bellingham
| Schedule | Weekly | Monthly | Annual |
|---|---|---|---|
| Full-Time (40 hrs) | $1,900.43 | $8,235 | $98,822 |
| Part-Time (24 hrs) | $1,140.26 | $4,941 | $59,293 |
| Per Diem (16 hrs) | $760.17 | $3,294 | $39,529 |
Compare PT Wages With Similar Roles
| Role | Median Hourly |
|---|---|
| Physical Therapist (Bellingham) | $47.51 |
| Physical Therapist Assistant (National Avg) | $31.26 |
| Occupational Therapist (National Avg) | $47.00 |
| Chiropractor (National Avg) | $36.85 |
| Exercise Physiologist (National Avg) | $26.75 |
Physical Therapists in Bellingham, WA earn a median of $98,823 per year (2026 est.), which is 6.14% lower than the national median of $105,288 and 10.10% below the Washington state average of $109,925.
Physical Therapist Hourly Pay vs. Cost of Living
Working 24h/week at $47.51/hr = $59,293/year (purchasing power: $57,380).
Working 40h/week (full-time) = $98,822/year (purchasing power: $95,634).
CoL index: 103.334 (100 = national average).
2019 BLS Actual
$38.03/hr
2025 BLS Actual
$46.37/hr
2026 Current Est.
$47.51/hr
2019–2027 Growth
+28.0%
Hourly Rate Trajectory for Physical Therapists in Bellingham (2019–2027)
2019–2025: actual BLS OEWS data for this metro area. 2026+: CAGR 2.46% projection.
| Year | Hourly Rate | Status |
|---|---|---|
| 2019 | $38.03/hr | Actual |
| 2020 | $41.71/hr | Actual |
| 2021 | $45.97/hr | Actual |
| 2022 | $45.42/hr | Actual |
| 2023 | $40.55/hr | Actual |
| 2024 | $45.74/hr | Actual |
| 2025 | $46.37/hr | Actual |
| 2026(current) | $47.51/hr | Estimated |
| 2027 | $48.68/hr | Projected |
Based on 7 years of BLS OEWS metropolitan area data, the median hourly rate for physical therapists in Bellingham grew 21.9% from $38.03/hr (2019) to $46.37/hr (2025). At a 2.46% projected growth rate, hourly pay is expected to reach $48.68/hr by 2027. Part-time and per-diem physical therapists can use this multi-year trend to benchmark future contract negotiations.
Note: Historical values (2019–2025) are actual BLS OEWS figures for the Bellingham metropolitan area, sourced from annual Occupational Employment and Wage Statistics surveys. 2026–2026 figures are current estimates, and 2027 values are projections, calculated using a 2.46% CAGR derived from 7-year BLS historical data. Actual salaries may vary based on employer, experience, certifications, and local market conditions.
Working as an Hourly Physical Therapist in Bellingham
Considering part-time work, a physical therapist making $47.51 per hour and working 24 hours weekly can expect to earn around $59,648 annually. This contrasts sharply with full-time therapists who typically add up their earnings based on a higher volume of patients. Moreover, the world of per diem and agency work offers potential higher earnings; many per diem physical therapists in Bellingham can command rates between $50 and $75 per hour. Travel contracts may pay well, reaching between $1,800 and $2,800 weekly. However, compensation varies across work settings; outpatient clinics may offer lower hourly rates compared to skilled nursing facilities and hospitals. When negotiating, physical therapists in Bellingham should assess the value of healthcare benefits against potential higher wages that lack those perks, tailoring their goals based on personal needs and market trends.
More salary data for Bellingham, WA:
Frequently Asked Questions
What is the hourly rate for physical therapists in Bellingham in 2026?
How much do part-time physical therapists make in Bellingham?
Are physical therapists in Bellingham paid hourly or salary?
How much does a full-time physical therapist make per year in Bellingham?
Do physical therapists earn more per hour working part-time in Bellingham?
Related Pages
Compare Salaries
Career Resources
Nearby Cities in Washington
Written by Alex Morgan, DPT
Career Analyst
Alex Morgan has over 10 years of experience in physical therapy. They specialize in orthopedic rehabilitation. Alex works in a private practice setting.
Methodology & Data Source
Hourly wage figures on this page are 2026 projections based on the Bureau of Labor Statistics Occupational Employment and Wage Statistics (OEWS) survey, May 2026 release. A 2.46% compound annual growth rate (CAGR), derived from 6-year national BLS wage trends, was applied to estimate current 2026 hourly rates for physical therapists in Bellingham. Part-time and full-time income estimates assume consistent weekly hours and do not account for overtime, benefits, or seasonal variation.
Data Sources & Methodology
Source: BLS, OEWS, 7-year dataset (–). Per-city data from annual BLS metropolitan area surveys.
2026 figures are projected from 2025 BLS data using a compound annual growth rate (CAGR) of 2.46%, derived from historical BLS wage trends for physical therapists (SOC 29-1123).
Compiled and verified by Alex Morgan, DPT, a licensed physical therapist with 10+ years of clinical experience. · View source data at BLS.gov