Physical Therapist Salary in Bellingham, WA: $98,823 (2026)
Quick Answer:A full-time physical therapist in Bellingham, WA earns a median $98,823/year (≈ $47.51/hour) in nominal terms for 2026 — projected from BLS OEWS 2025 (SOC 29-1123). Once you factor in Bellingham's price level (3% above national, BEA RPP 103.3), that paycheck buys what $95,635 would nationally. Nominal pay sits 10.1% below the Washington state average.
Official BLS data · View source
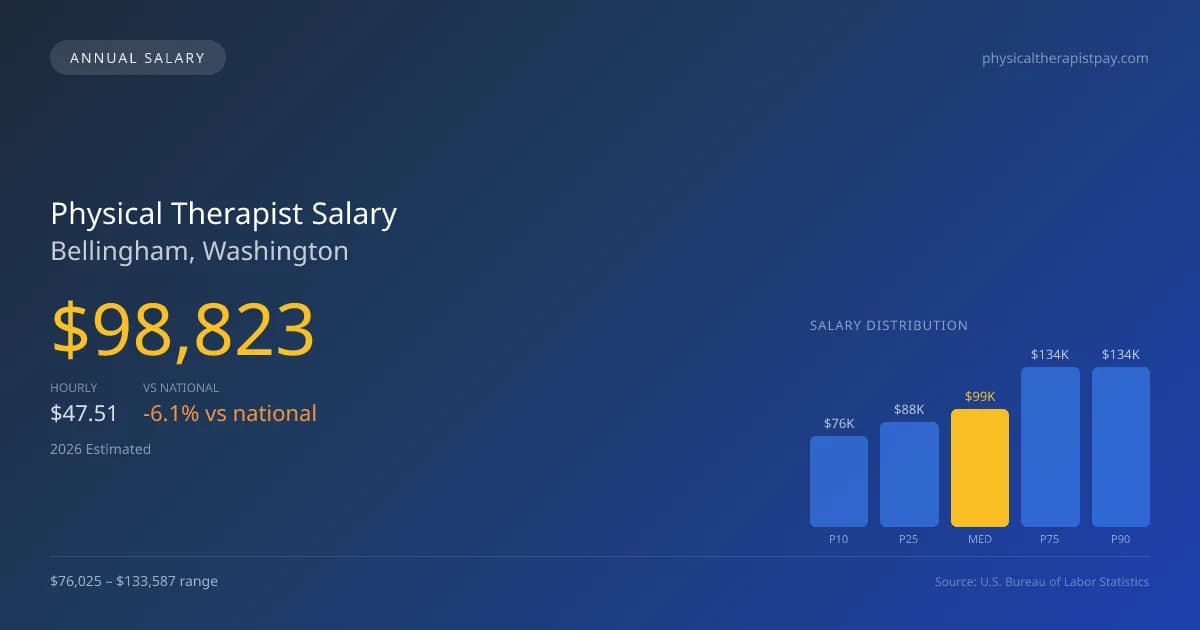
Physical therapists in Bellingham, Washington, can expect a median annual salary of $98,823 in 2026, which reflects a competitive landscape compared to the national median of $105,288. The salary range for physical therapists here varies significantly from $76,025 at the 10th percentile to $133,587 at the 90th percentile. This data is drawn from official Bureau of Labor Statistics (BLS) OEWS surveys and points to the dichotomy of employment settings in Bellingham, where outpatient chains and skilled nursing facilities may offer differing pay scales. While outpatient orthopedic clinics often provide a base salary that can be offset by productivity bonuses, hospital systems may have more stable compensation structures, ultimately influencing the overall job market for physical therapy in the region.
Salary Breakdown
| Percentile | Annual | Hourly |
|---|---|---|
| Entry Level (P10) | $76,025 | $36.56 |
| Lower Range (P25) | $87,808 | $42.21 |
| Median (P50)(typical) | $98,823 | $47.51 |
| Upper Range (P75) | $133,587 | $64.22 |
| Top Earners (P90) | $133,587 | $64.22 |
Median Salary Position
6.14% below the national average
2026 Salary Percentile Distribution in Bellingham
In Bellingham, WA, the physical therapist salary spread from the 10th to 90th percentile is $57,562 (2026 est.). At $98,823, the local median is 6.14% below the national median of $105,288.
Salary Calculator
At 40 hours/week in Bellingham: You'd be in the lower-middle range
How Bellingham Physical Therapist Pay Compares
Bellingham median: $98,823/year (2026)
| Compared To | Median Salary | Bellingham Pays |
|---|---|---|
| Washington Average | $109,925 | -10.10% less |
| National Average | $105,288 | -6.14% less |
Physical Therapists in Bellingham, WA earn a median of $98,823 per year (2026 est.), which is 6.14% lower than the national median of $105,288 and 10.10% below the Washington state average of $109,925.
Cost-of-Living Adjusted Salary
Bellingham has a cost of living 3.33% above the national average.
Adjusted salary = nominal × (100 / CoL index). CoL index: 100 = national average.
Bellingham, WA has a cost-of-living index of 103.334 (above the national average of 100). While the nominal salary of $98,823 is competitive, the higher cost of living reduces purchasing power to an effective $95,635 — a 3.23% reduction.
Compare Purchasing Power
Select a city to see how your salary compares after cost of living
Select a city above to compare purchasing power
2019 BLS Actual
$79,100
2025 BLS Actual
$96,450
2026 Current Est.
$98,823
2019–2027 Growth
+28.0%
Salary Trajectory for Physical Therapists in Bellingham (2019–2027)
2019–2025: actual BLS OEWS data for this metro area. 2026+: CAGR 2.46% projection.
| Year | Annual Salary | Status |
|---|---|---|
| 2019 | $79,100 | Actual |
| 2020 | $86,760 | Actual |
| 2021 | $95,620 | Actual |
| 2022 | $94,470 | Actual |
| 2023 | $84,350 | Actual |
| 2024 | $95,130 | Actual |
| 2025 | $96,450 | Actual |
| 2026(current) | $98,823 | Estimated |
| 2027 | $101,254 | Projected |
Based on 7 years of BLS OEWS data for the Bellingham metropolitan area, the median physical therapist salary grew 21.9% from $79,100 (2019) to $96,450 (2025). At a 2.46% compound annual growth rate, salaries are projected to reach $101,254 by 2027 — a total increase of $22,154 (28.01%) from 2019.
Note: Historical values (2019–2025) are actual BLS OEWS figures for the Bellingham metropolitan area, sourced from annual Occupational Employment and Wage Statistics surveys. 2026–2026 figures are current estimates, and 2027 values are projections, calculated using a 2.46% CAGR derived from 7-year BLS historical data. Actual salaries may vary based on employer, experience, certifications, and local market conditions.
Salary by Experience Level
| Experience | Estimated Salary Range |
|---|---|
| 0-2 years (New Graduate) | $76,025 – $87,808 |
| 3-5 years (Mid Career) | $87,808 – $98,823 |
| 5+ years (Experienced) | $98,823 – $133,587 |
| 10+ years (Top Earner) | $133,587 – $133,587 |
PT salary ranges estimated from BLS percentile data. Individual physical therapist compensation varies by employer, certifications, and specialization.
Physical Therapist Job Market in Bellingham
In Bellingham, approximately 160 physical therapists currently work, navigating a local job market where the cost of living index stands at 103.334, indicating a higher expense compared to the national average. This reality affects the purchasing power of physical therapist pay in Bellingham, WA. Employers that typically offer higher salaries include hospital inpatient rehabilitation settings and outpatient orthopedic chains like Athletico, as well as specialized home health agencies. Differentiation in pay often arises from factors such as productivity expectations, board certification stipends like OCS and SCS, and the model of care practiced, with cash-pay models generally outperforming insurance reimbursement setups. To maximize earnings in this market, physical therapists may consider pursuing specialty certifications, enhancing their business acumen, and exploring opportunities for clinical ownership or higher-earning travel positions.
More salary data for Bellingham, WA:
Frequently Asked Questions
How much do physical therapists make in Bellingham, WA in 2026?
Is Bellingham, WA a good place to work as a physical therapist?
Can physical therapists make $100K in Bellingham?
What is the cost-of-living adjusted physical therapist salary in Bellingham?
How much does a physical therapist make per hour in Bellingham?
Related Pages
Compare Salaries
Career Resources
Nearby Cities in Washington
Written by Alex Morgan, DPT
Career Analyst
Alex Morgan has over 10 years of experience in physical therapy. They specialize in orthopedic rehabilitation. Alex works in a private practice setting.
Methodology & Data Source
Salary figures on this page are 2026 projections based on the Bureau of Labor Statistics Occupational Employment and Wage Statistics (OEWS) survey, May 2026 release. The BLS reported a median annual salary of $96,450 for physical therapistsin the Bellingham metropolitan area. A 2.46% compound annual growth rate (CAGR), calculated from 6-year national BLS wage trends, was applied to project current 2026 compensation. Percentile ranges (P10–P90) represent the full salary distribution across experience levels and practice settings in this market.
Data Sources & Methodology
Source: BLS, OEWS, 7-year dataset (–). Per-city data from annual BLS metropolitan area surveys.
2026 figures are projected from 2025 BLS data using a compound annual growth rate (CAGR) of 2.46%, derived from historical BLS wage trends for physical therapists (SOC 29-1123).
Compiled and verified by Alex Morgan, DPT, a licensed physical therapist with 10+ years of clinical experience. · View source data at BLS.gov