Senior Physical Therapist Salary in Bellingham, WA: $133,587 (2026)
Quick Answer:The top tier of physical therapists working in Bellingham, WA — those at or above the 90th percentile — pull in $133,587/year or more for 2026, based on BLS OEWS 2025 estimates for SOC 29-1123. Strip back Bellingham's price premium (BEA RPP 103.3, 3% above national) and that top-decile pay carries the same buying power as $129,277 in average-cost America. The 35% spread above city median typically rewards 7+ years of practice or specialty credentials.
Official BLS data · View source
In Bellingham, WA, senior physical therapists looking to maximize their earning potential find remarkable opportunities within the local market. The projected median annual salary for experienced professionals sits at $98,823 in 2026, but top-tier earners can elevate their compensation significantly, with salaries reaching up to $133,587 for the 90th percentile. This significant gap between the median and top salaries highlights the experience premium associated with higher-level roles. Achieving these top-tier pay levels requires not only years of dedicated practice but also advanced specializations, leadership skills, and a strong understanding of the local healthcare landscape. Experienced physical therapists in Bellingham can expect to be compensated well, especially those who position themselves within lucrative specialties or managerial roles.
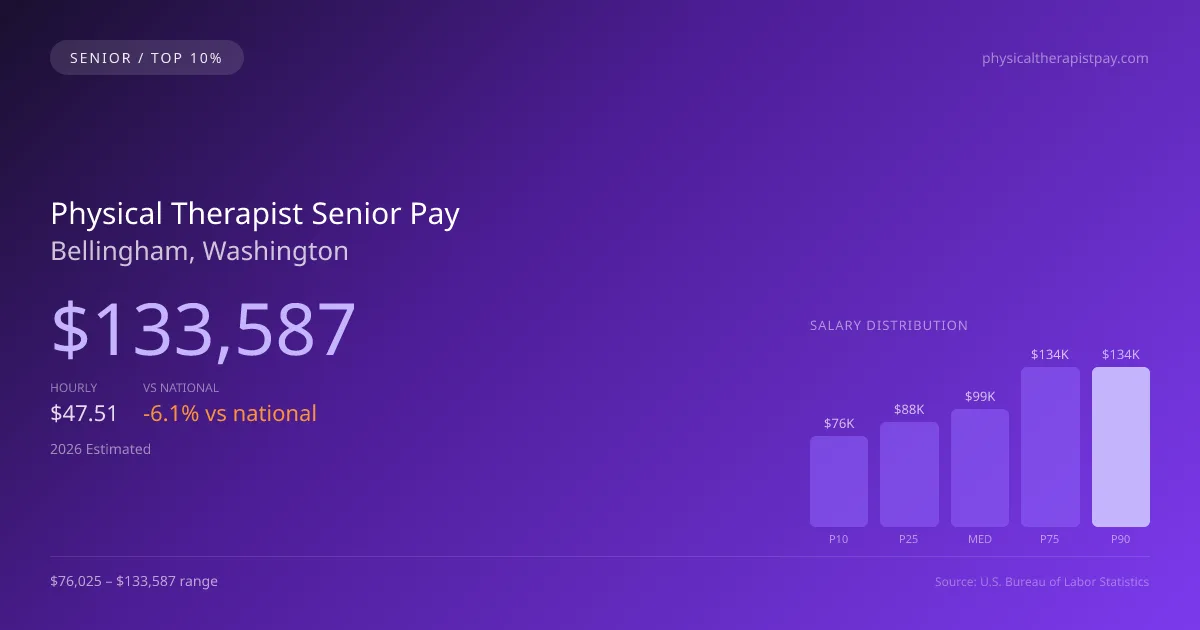
2026 Salary Percentile Distribution in Bellingham
Experienced physical therapists at the top of the pay scale in Bellingham earn between $133,587 and $133,587 per year (2026 est.). This $57,562 range from 10th to 90th percentile reflects significant earnings potential growth over a career. The Bellingham median of $98,823 sits 6.14% below the US median.
Top PT Salary Comparison
| Level | Bellingham | National |
|---|---|---|
| Median (P50) | $98,823 | $105,288 |
| 75th Percentile | $133,587 | $124,141 |
| 90th Percentile (Top 10%) | $133,587 | $138,464 |
In Bellingham, experienced physical therapists (P90) earn 35.18% more than the local median — reflecting the significant value of specialization and tenure in this market.
What Drives Top Physical Therapist Pay in Bellingham
Advanced Certifications in Washington
WA physical therapists with additional specialty certifications within the physical therapy field earn significantly above the $98,823 median. Expanded-scope credentials are increasingly valued by Bellingham employers.
Specialty Focus
Physical Therapists focusing on high-acuity or specialty areas within the physical therapy field in Bellingham command premium compensation, often reaching the $133,587–$133,587 range.
Large Health-System & Multi-Site Experience
Large hospital systems and multi-site employers in the Bellingham metro area often pay above-market rates for experienced physical therapists who demonstrate efficiency and leadership.
Employer Loyalty & Patient Relationships
Long-tenured physical therapists in Bellingham with established relationships have strong negotiating leverage. In this developing market, retention bonuses and annual raises are common for top performers.
Continuing Education & Leadership
Physical Therapists in Washington who pursue advanced degrees, mentor junior staff, or lead clinical education programs position themselves for the highest compensation tiers and management roles.
Physical Therapist Career & Wage Growth Path in Bellingham
Clinical Physical Therapist
0-5 yearsSenior/Lead Physical Therapist
5-10 yearsPhysical Therapist Department Manager
10+ yearsEducator / Specialty Leadership
AdvancedBellingham ranks #36 of 50 Washington cities for top earner physical therapist salary (90th percentile: $133,587).
Top 10% physical therapist compensation in Bellingham ($133,587) is 6.61% below the Washington average P90 ($143,039).
2019 BLS Actual
$111,230
2025 BLS Actual
$130,380
2026 Current Est.
$133,587
2019–2027 Growth
+23.1%
Salary Trajectory for Physical Therapists in Bellingham (2019–2027)
2019–2025: actual BLS OEWS data for this metro area. 2026+: CAGR 2.46% projection.
| Year | Annual Salary | Status |
|---|---|---|
| 2019 | $111,230 | Actual |
| 2020 | $110,260 | Actual |
| 2021 | $102,030 | Actual |
| 2022 | $115,570 | Actual |
| 2023 | $121,770 | Actual |
| 2024 | $127,320 | Actual |
| 2025 | $130,380 | Actual |
| 2026(current) | $133,587 | Estimated |
| 2027 | $136,874 | Projected |
Top-earning physical therapists (90th percentile) in Bellingham saw their compensation grow 17.2% from $111,230 in 2019 to $130,380 in 2025, based on 7 years of BLS OEWS data for this metropolitan area. At a 2.46% annual growth rate, senior-level pay is projected to reach $136,874 by 2027, reflecting continued demand for clinical expertise and expanded-function credentials.
Note: Historical values (2019–2025) are actual BLS OEWS figures for the Bellingham metropolitan area, sourced from annual Occupational Employment and Wage Statistics surveys. 2026–2026 figures are current estimates, and 2027 values are projections, calculated using a 2.46% CAGR derived from 7-year BLS historical data. Actual salaries may vary based on employer, experience, certifications, and local market conditions.
Maximizing Your Physical Therapist Earnings in Bellingham
Navigating the complexities of senior physical therapist pay in WA, professionals who specialize in areas such as orthopedic (OCS), sports (SCS), or geriatric (GCS) care command higher salaries compared to their peers in general practice. Those working in outpatient orthopedic clinics, specialized sports medicine facilities, or even home health agencies may see distinct differences in pay, driven largely by employer type and the specific demands of their practice setting. In addition, advanced credentials like a Doctor of Physical Therapy (DPT) or board certifications enhance marketability and salary prospects, especially as clinics and healthcare organizations seek leaders who can deliver specialized care. Beyond direct salary, variables such as productivity expectations, clinic ownership equity, and whether a practice model is cash-pay or insurance-based also play a crucial role in shaping the financial landscape for senior physical therapists. By strategically pursuing certifications and leadership opportunities, seasoned professionals in Bellingham can position themselves for exceptional senior pay and rewarding career trajectories.
More salary data for Bellingham, WA:
Frequently Asked Questions
How much do experienced physical therapists make in Bellingham in 2026?
What drives higher physical therapist pay in Bellingham?
What certifications boost physical therapist salary in Bellingham?
Can experienced physical therapists make six figures in Bellingham?
How much does physical therapist salary increase over time in Bellingham?
Related Pages
Compare Salaries
Career Resources
Nearby Cities in Washington
Written by Alex Morgan, DPT
Career Analyst
Alex Morgan has over 10 years of experience in physical therapy. They specialize in orthopedic rehabilitation. Alex works in a private practice setting.
Methodology & Data Source
Top-earner salary figures on this page are 2026 projections derived from the Bureau of Labor Statistics Occupational Employment and Wage Statistics (OEWS) survey, May 2026 release. BLS reported a 90th percentile salary of $130,380 for physical therapists in the Bellingham metro area. A 2.46% compound annual growth rate (CAGR), calculated from 6-year national BLS wage trends, was applied to project current 2026 senior-level compensation. Individual earnings depend on certifications, specialization, practice type, and years of clinical experience.
Data Sources & Methodology
Source: BLS, OEWS, 7-year dataset (–). Per-city data from annual BLS metropolitan area surveys.
2026 figures are projected from 2025 BLS data using a compound annual growth rate (CAGR) of 2.46%, derived from historical BLS wage trends for physical therapists (SOC 29-1123).
Compiled and verified by Alex Morgan, DPT, a licensed physical therapist with 10+ years of clinical experience. · View source data at BLS.gov