Physical Therapist Salary in Branson, MO: $94,957 (2026)
Quick Answer:A full-time physical therapist in Branson, MO earns a median $94,957/year (≈ $45.66/hour) in nominal terms for 2026 — projected from BLS OEWS 2025 (SOC 29-1123). Once you factor in Branson's price level (10% below national, BEA RPP 89.6), that paycheck buys what $105,979 would nationally. Nominal pay sits 7.1% below the Missouri state average.
Based on BLS state-level estimates · View source
In 2026, the physical therapist salary in Branson is projected to reach a median of $94,957 annually. This figure reflects the income potential in a market where therapists navigate productivity pressure, often striving to maximize visits per day to optimize their hourly compensation. The salary spectrum ranges from $77,985 at the 10th percentile to $117,736 at the 90th percentile, indicating a competitive local market for physical therapists. These estimates are informed by local data derived from state-level BLS statistics and regional price adjustments, illustrating the unique job dynamics present in Branson's healthcare industry.
About the Branson Market
Salary estimated from Missouri average ($88,000) adjusted for local cost of living.
Salary Breakdown
| Percentile | Annual | Hourly |
|---|---|---|
| Entry Level (P10) | $77,985 | $37.49 |
| Lower Range (P25) | $83,252 | $40.02 |
| Median (P50)(typical) | $94,957 | $45.66 |
| Upper Range (P75) | $109,172 | $52.49 |
| Top Earners (P90) | $117,736 | $56.60 |
Median Salary Position
9.81% below the national average
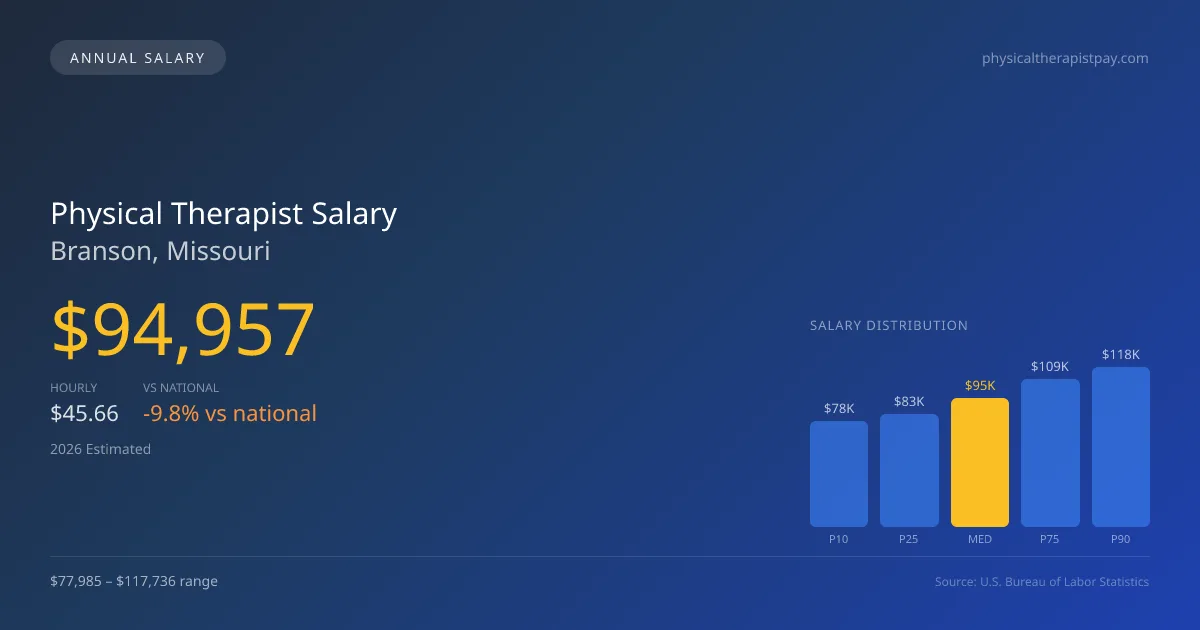
2026 Salary Percentile Distribution in Branson
In Branson, MO, the physical therapist salary spread from the 10th to 90th percentile is $39,751 (2026 est.). At $94,957, the local median is 9.81% below the national median of $105,288.
Salary Calculator
At 40 hours/week in Branson: You'd be in the lower-middle range
How Branson Physical Therapist Pay Compares
Branson median: $94,957/year (2026)
| Compared To | Median Salary | Branson Pays |
|---|---|---|
| Missouri Average | $102,214 | -7.10% less |
| National Average | $105,288 | -9.81% less |
Physical Therapists in Branson, MO earn a median of $94,957 per year (2026 est.), which is 9.81% lower than the national median of $105,288 and 7.10% below the Missouri state average of $102,214.
Cost-of-Living Adjusted Salary
Branson has a cost of living 10.40% below the national average, meaning your salary goes further here.
Adjusted salary = nominal × (100 / CoL index). CoL index: 100 = national average.
Branson, MO has a cost-of-living index of 89.6 (below the national average of 100). A physical therapist earning $94,957 nominally has purchasing power equivalent to $105,979 in an average-cost city — an effective 11.61% boost.
Compare Purchasing Power
Select a city to see how your salary compares after cost of living
Select a city above to compare purchasing power
2019 BLS Actual
$80,664
2025 BLS Actual
$92,677
2026 Current Est.
$94,957
2019–2027 Growth
+20.6%
Salary Trajectory for Physical Therapists in Branson (2019–2027)
2019–2025: actual BLS OEWS data for this metro area. 2026+: CAGR 2.46% projection.
| Year | Annual Salary | Status |
|---|---|---|
| 2019 | $80,664 | Actual |
| 2020 | $82,080 | Actual |
| 2021 | $86,238 | Actual |
| 2022 | $88,132 | Actual |
| 2023 | $89,926 | Actual |
| 2024 | $73,272 | Actual |
| 2025 | $92,677 | Actual |
| 2026(current) | $94,957 | Estimated |
| 2027 | $97,293 | Projected |
Based on 7 years of BLS OEWS data for the Branson metropolitan area, the median physical therapist salary grew 14.9% from $80,664 (2019) to $92,677 (2025). At a 2.46% compound annual growth rate, salaries are projected to reach $97,293 by 2027 — a total increase of $16,629 (20.62%) from 2019.
Note: Historical values (2019–2025) are actual BLS OEWS figures for the Branson metropolitan area, sourced from annual Occupational Employment and Wage Statistics surveys. 2026–2026 figures are current estimates, and 2027 values are projections, calculated using a 2.46% CAGR derived from 7-year BLS historical data. Actual salaries may vary based on employer, experience, certifications, and local market conditions.
Salary by Experience Level
| Experience | Estimated Salary Range |
|---|---|
| 0-2 years (New Graduate) | $77,985 – $83,252 |
| 3-5 years (Mid Career) | $83,252 – $94,957 |
| 5+ years (Experienced) | $94,957 – $109,172 |
| 10+ years (Top Earner) | $109,172 – $117,736 |
PT salary ranges estimated from BLS percentile data. Individual physical therapist compensation varies by employer, certifications, and specialization.
Physical Therapist Job Market in Branson
While there are only four physical therapists employed in Branson, the cost of living index stands at 89.6, suggesting a lower-than-average living expense compared to the national average. This reality positively influences take-home pay and spending capacity for local practitioners. Among potential employers, outpatient orthopedic clinics, particularly those affiliated with larger chains like Athletico, often present more lucrative opportunities. However, the spread in pay can be significant depending on factors such as productivity expectations, specialized board certifications (OCS, SCS), and the practice model used (cash-pay vs. insurance). To enhance earning potential in this environment, physical therapists in Branson should consider pursuing specialties that offer stipends, increasing their patient volume, or seeking employment opportunities in more lucrative clinical settings.
More salary data for Branson, MO:
Frequently Asked Questions
How much do physical therapists make in Branson, MO in 2026?
Is Branson, MO a good place to work as a physical therapist?
Can physical therapists make $100K in Branson?
What is the cost-of-living adjusted physical therapist salary in Branson?
How much does a physical therapist make per hour in Branson?
Related Pages
Compare Salaries
Career Resources
Nearby Cities in Missouri
Written by Alex Morgan, DPT
Career Analyst
Alex Morgan has over 10 years of experience in physical therapy. They specialize in orthopedic rehabilitation. Alex works in a private practice setting.
Methodology & Data Source
Salary figures on this page are 2026 projections based on the Bureau of Labor Statistics Occupational Employment and Wage Statistics (OEWS) survey, May 2026 release. The BLS reported a median annual salary of $92,677 for physical therapistsin the Branson metropolitan area. A 2.46% compound annual growth rate (CAGR), calculated from 6-year national BLS wage trends, was applied to project current 2026 compensation. Percentile ranges (P10–P90) represent the full salary distribution across experience levels and practice settings in this market.
Data Sources & Methodology
Salary data for Branson is estimated from official BLS state-level occupational wage data (2025), adjusted for regional cost-of-living differences using BEA RPP (Regional Price Parities).
2026 figures are projected from 2025 BLS data using a compound annual growth rate (CAGR) of 2.46%, derived from historical BLS wage trends for physical therapists (SOC 29-1123).
Compiled and verified by Alex Morgan, DPT, a licensed physical therapist with 10+ years of clinical experience. · View source data at BLS.gov