Physical Therapist Salary in Florissant, MO: $101,594 (2026)
Quick Answer:A full-time physical therapist in Florissant, MO earns a median $101,594/year (≈ $48.84/hour) in nominal terms for 2026 — projected from BLS OEWS 2025 (SOC 29-1123). Once you factor in Florissant's price level (10% below national, BEA RPP 89.6), that paycheck buys what $113,386 would nationally. Nominal pay sits 0.6% below the Missouri state average.
Based on BLS state-level estimates · View source
Florissant, Missouri, presents an interesting salary picture for physical therapists, particularly reflective of the outpatient versus inpatient care dynamic. Projected for 2026, physical therapists in the area can expect a median annual salary of $101,594, which is slightly below the national median of $105,288. The salary range for positions in Florissant spans from $73,267 at the lower tenth percentile to $137,191 at the top ninetieth percentile, indicating a varied market influenced by employment settings. Those working in outpatient orthopedic clinics often face different pay structures compared to their counterparts in hospitals or skilled nursing facilities, which can significantly impact earnings based on productivity demands and the business model employed.
About the Florissant Market
Salary estimated from Missouri average ($88,000) adjusted for local cost of living.
Salary Breakdown
| Percentile | Annual | Hourly |
|---|---|---|
| Entry Level (P10) | $73,267 | $35.23 |
| Lower Range (P25) | $82,174 | $39.51 |
| Median (P50)(typical) | $101,594 | $48.84 |
| Upper Range (P75) | $118,512 | $56.98 |
| Top Earners (P90) | $137,191 | $65.95 |
Median Salary Position
3.51% below the national average
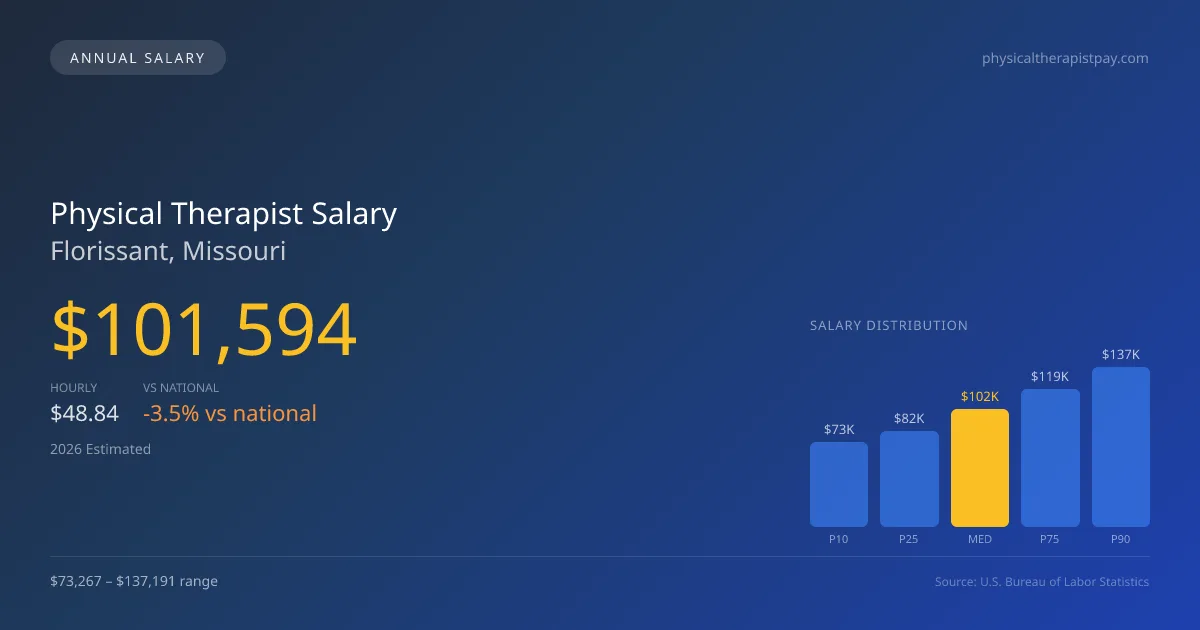
2026 Salary Percentile Distribution in Florissant
In Florissant, MO, the physical therapist salary spread from the 10th to 90th percentile is $63,924 (2026 est.). At $101,594, the local median is 3.51% below the national median of $105,288.
Salary Calculator
At 40 hours/week in Florissant: You'd be in the lower-middle range
How Florissant Physical Therapist Pay Compares
Florissant median: $101,594/year (2026)
| Compared To | Median Salary | Florissant Pays |
|---|---|---|
| Missouri Average | $102,207 | -0.60% less |
| National Average | $105,288 | -3.51% less |
Physical Therapists in Florissant, MO earn a median of $101,594 per year (2026 est.), which is 3.51% lower than the national median of $105,288 and 0.60% below the Missouri state average of $102,207.
Cost-of-Living Adjusted Salary
Florissant has a cost of living 10.40% below the national average, meaning your salary goes further here.
Adjusted salary = nominal × (100 / CoL index). CoL index: 100 = national average.
Florissant, MO has a cost-of-living index of 89.6 (below the national average of 100). A physical therapist earning $101,594 nominally has purchasing power equivalent to $113,386 in an average-cost city — an effective 11.61% boost.
Compare Purchasing Power
Select a city to see how your salary compares after cost of living
Select a city above to compare purchasing power
2019 BLS Actual
$86,302
2025 BLS Actual
$99,155
2026 Current Est.
$101,594
2019–2027 Growth
+20.6%
Salary Trajectory for Physical Therapists in Florissant (2019–2027)
2019–2025: actual BLS OEWS data for this metro area. 2026+: CAGR 2.46% projection.
| Year | Annual Salary | Status |
|---|---|---|
| 2019 | $86,302 | Actual |
| 2020 | $87,817 | Actual |
| 2021 | $92,265 | Actual |
| 2022 | $94,292 | Actual |
| 2023 | $96,212 | Actual |
| 2024 | $78,394 | Actual |
| 2025 | $99,155 | Actual |
| 2026(current) | $101,594 | Estimated |
| 2027 | $104,093 | Projected |
Based on 7 years of BLS OEWS data for the Florissant metropolitan area, the median physical therapist salary grew 14.9% from $86,302 (2019) to $99,155 (2025). At a 2.46% compound annual growth rate, salaries are projected to reach $104,093 by 2027 — a total increase of $17,791 (20.61%) from 2019.
Note: Historical values (2019–2025) are actual BLS OEWS figures for the Florissant metropolitan area, sourced from annual Occupational Employment and Wage Statistics surveys. 2026–2026 figures are current estimates, and 2027 values are projections, calculated using a 2.46% CAGR derived from 7-year BLS historical data. Actual salaries may vary based on employer, experience, certifications, and local market conditions.
Salary by Experience Level
| Experience | Estimated Salary Range |
|---|---|
| 0-2 years (New Graduate) | $73,267 – $82,174 |
| 3-5 years (Mid Career) | $82,174 – $101,594 |
| 5+ years (Experienced) | $101,594 – $118,512 |
| 10+ years (Top Earner) | $118,512 – $137,191 |
PT salary ranges estimated from BLS percentile data. Individual physical therapist compensation varies by employer, certifications, and specialization.
Physical Therapist Job Market in Florissant
In analyzing the local job market, it is noteworthy that only 11 physical therapists are currently employed in the Florissant area, suggesting potential room for growth in this profession. With a cost-of-living index of 89.6, professionals in Florissant are able to enjoy a favorable purchasing power, which can affect overall job satisfaction and lifestyle quality. Outpatient clinics such as ATI or Athletico may offer slightly lower initial salaries but can enhance earnings through productivity bonuses. Variability in pay is also influenced by factors such as specialization certifications, the nature of reimbursement models, and clinic ownership structures. For those looking to optimize their physical therapist pay in Florissant, aiming for board certification and seeking opportunities in specialized settings like sports medicine or pediatrics can offer the best routes to higher compensation.
More salary data for Florissant, MO:
Frequently Asked Questions
How much do physical therapists make in Florissant, MO in 2026?
Is Florissant, MO a good place to work as a physical therapist?
Can physical therapists make $100K in Florissant?
What is the cost-of-living adjusted physical therapist salary in Florissant?
How much does a physical therapist make per hour in Florissant?
Related Pages
Compare Salaries
Career Resources
Nearby Cities in Missouri
Written by Alex Morgan, DPT
Career Analyst
Alex Morgan has over 10 years of experience in physical therapy. They specialize in orthopedic rehabilitation. Alex works in a private practice setting.
Methodology & Data Source
Salary figures on this page are 2026 projections based on the Bureau of Labor Statistics Occupational Employment and Wage Statistics (OEWS) survey, May 2026 release. The BLS reported a median annual salary of $99,155 for physical therapistsin the Florissant metropolitan area. A 2.46% compound annual growth rate (CAGR), calculated from 6-year national BLS wage trends, was applied to project current 2026 compensation. Percentile ranges (P10–P90) represent the full salary distribution across experience levels and practice settings in this market.
Data Sources & Methodology
Salary data for Florissant is estimated from official BLS state-level occupational wage data (2025), adjusted for regional cost-of-living differences using BEA RPP (Regional Price Parities).
2026 figures are projected from 2025 BLS data using a compound annual growth rate (CAGR) of 2.46%, derived from historical BLS wage trends for physical therapists (SOC 29-1123).
Compiled and verified by Alex Morgan, DPT, a licensed physical therapist with 10+ years of clinical experience. · View source data at BLS.gov