Physical Therapist Salary in Liberty, MO: $100,700 (2026)
Quick Answer:A full-time physical therapist in Liberty, MO earns a median $100,700/year (≈ $48.41/hour) in nominal terms for 2026 — projected from BLS OEWS 2025 (SOC 29-1123). Once you factor in Liberty's price level (10% below national, BEA RPP 89.6), that paycheck buys what $112,388 would nationally. Nominal pay sits 1.5% below the Missouri state average.
Based on BLS state-level estimates · View source
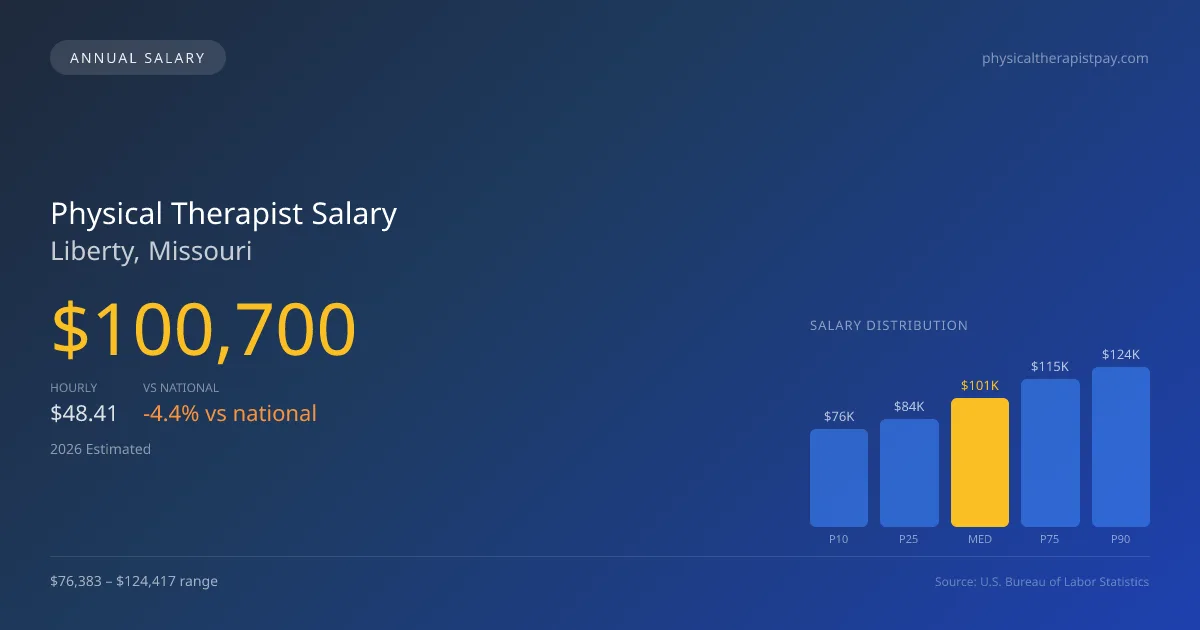
In Liberty, Missouri, physical therapists can anticipate a median annual salary of $100,700 in 2026, slightly below the national median of $105,288. The salary range is quite broad, with entry-level positions earning as little as $76,383, while highly experienced therapists may earn up to $124,417. These estimates are derived from 2025 BLS data and adjusted for regional cost factors. The disparity in salary often hinges on the type of healthcare setting in which therapists find employment. Outpatient clinics, which are prevalent in Liberty, may offer lower base salaries compared to hospital systems, yet they often include performance bonuses tied to productivity, which can enhance overall compensation for those meeting or exceeding patient care goals.
About the Liberty Market
Salary estimated from Missouri average ($88,000) adjusted for local cost of living.
Salary Breakdown
| Percentile | Annual | Hourly |
|---|---|---|
| Entry Level (P10) | $76,383 | $36.72 |
| Lower Range (P25) | $84,133 | $40.45 |
| Median (P50)(typical) | $100,700 | $48.41 |
| Upper Range (P75) | $114,913 | $55.25 |
| Top Earners (P90) | $124,417 | $59.82 |
Median Salary Position
4.36% below the national average
2026 Salary Percentile Distribution in Liberty
In Liberty, MO, the physical therapist salary spread from the 10th to 90th percentile is $48,034 (2026 est.). At $100,700, the local median is 4.36% below the national median of $105,288.
Salary Calculator
At 40 hours/week in Liberty: You'd be above the median
How Liberty Physical Therapist Pay Compares
Liberty median: $100,700/year (2026)
| Compared To | Median Salary | Liberty Pays |
|---|---|---|
| Missouri Average | $102,233 | -1.50% less |
| National Average | $105,288 | -4.36% less |
Physical Therapists in Liberty, MO earn a median of $100,700 per year (2026 est.), which is 4.36% lower than the national median of $105,288 and 1.50% below the Missouri state average of $102,233.
Cost-of-Living Adjusted Salary
Liberty has a cost of living 10.40% below the national average, meaning your salary goes further here.
Adjusted salary = nominal × (100 / CoL index). CoL index: 100 = national average.
Liberty, MO has a cost-of-living index of 89.6 (below the national average of 100). A physical therapist earning $100,700 nominally has purchasing power equivalent to $112,388 in an average-cost city — an effective 11.61% boost.
Compare Purchasing Power
Select a city to see how your salary compares after cost of living
Select a city above to compare purchasing power
2019 BLS Actual
$85,542
2025 BLS Actual
$98,282
2026 Current Est.
$100,700
2019–2027 Growth
+20.6%
Salary Trajectory for Physical Therapists in Liberty (2019–2027)
2019–2025: actual BLS OEWS data for this metro area. 2026+: CAGR 2.46% projection.
| Year | Annual Salary | Status |
|---|---|---|
| 2019 | $85,542 | Actual |
| 2020 | $87,044 | Actual |
| 2021 | $91,453 | Actual |
| 2022 | $93,462 | Actual |
| 2023 | $95,365 | Actual |
| 2024 | $77,703 | Actual |
| 2025 | $98,282 | Actual |
| 2026(current) | $100,700 | Estimated |
| 2027 | $103,177 | Projected |
Based on 7 years of BLS OEWS data for the Liberty metropolitan area, the median physical therapist salary grew 14.9% from $85,542 (2019) to $98,282 (2025). At a 2.46% compound annual growth rate, salaries are projected to reach $103,177 by 2027 — a total increase of $17,635 (20.62%) from 2019.
Note: Historical values (2019–2025) are actual BLS OEWS figures for the Liberty metropolitan area, sourced from annual Occupational Employment and Wage Statistics surveys. 2026–2026 figures are current estimates, and 2027 values are projections, calculated using a 2.46% CAGR derived from 7-year BLS historical data. Actual salaries may vary based on employer, experience, certifications, and local market conditions.
Salary by Experience Level
| Experience | Estimated Salary Range |
|---|---|
| 0-2 years (New Graduate) | $76,383 – $84,133 |
| 3-5 years (Mid Career) | $84,133 – $100,700 |
| 5+ years (Experienced) | $100,700 – $114,913 |
| 10+ years (Top Earner) | $114,913 – $124,417 |
PT salary ranges estimated from BLS percentile data. Individual physical therapist compensation varies by employer, certifications, and specialization.
Physical Therapist Job Market in Liberty
The local job market for physical therapists in Liberty is relatively limited, with approximately five professionals currently practicing in the area. With a cost-of-living index at 89.6, living expenses are lower than the national average, a factor that positively influences take-home pay. In terms of compensation, outpatient orthopedic clinics like ATI and Athletico may offer competitive salaries but might not match the higher pay typically found in hospital inpatient rehabilitation settings. Factors contributing to the pay range include expected productivity levels, board certifications such as OCS or SCS, and whether the practice model is cash-based or accepts insurance. Therapists looking to maximize their salary in Liberty should consider obtaining specialized certifications and seek roles in environments that reward high productivity and offer performance-based incentives.
More salary data for Liberty, MO:
Frequently Asked Questions
How much do physical therapists make in Liberty, MO in 2026?
Is Liberty, MO a good place to work as a physical therapist?
Can physical therapists make $100K in Liberty?
What is the cost-of-living adjusted physical therapist salary in Liberty?
How much does a physical therapist make per hour in Liberty?
Related Pages
Compare Salaries
Career Resources
Nearby Cities in Missouri
Written by Alex Morgan, DPT
Career Analyst
Alex Morgan has over 10 years of experience in physical therapy. They specialize in orthopedic rehabilitation. Alex works in a private practice setting.
Methodology & Data Source
Salary figures on this page are 2026 projections based on the Bureau of Labor Statistics Occupational Employment and Wage Statistics (OEWS) survey, May 2026 release. The BLS reported a median annual salary of $98,282 for physical therapistsin the Liberty metropolitan area. A 2.46% compound annual growth rate (CAGR), calculated from 6-year national BLS wage trends, was applied to project current 2026 compensation. Percentile ranges (P10–P90) represent the full salary distribution across experience levels and practice settings in this market.
Data Sources & Methodology
Salary data for Liberty is estimated from official BLS state-level occupational wage data (2025), adjusted for regional cost-of-living differences using BEA RPP (Regional Price Parities).
2026 figures are projected from 2025 BLS data using a compound annual growth rate (CAGR) of 2.46%, derived from historical BLS wage trends for physical therapists (SOC 29-1123).
Compiled and verified by Alex Morgan, DPT, a licensed physical therapist with 10+ years of clinical experience. · View source data at BLS.gov