Physical Therapist Salary in Nixa, MO: $97,923 (2026)
Quick Answer:A full-time physical therapist in Nixa, MO earns a median $97,923/year (≈ $47.08/hour) in nominal terms for 2026 — projected from BLS OEWS 2025 (SOC 29-1123). Once you factor in Nixa's price level (10% below national, BEA RPP 89.6), that paycheck buys what $109,289 would nationally. Nominal pay sits 4.2% below the Missouri state average.
Based on BLS state-level estimates · View source
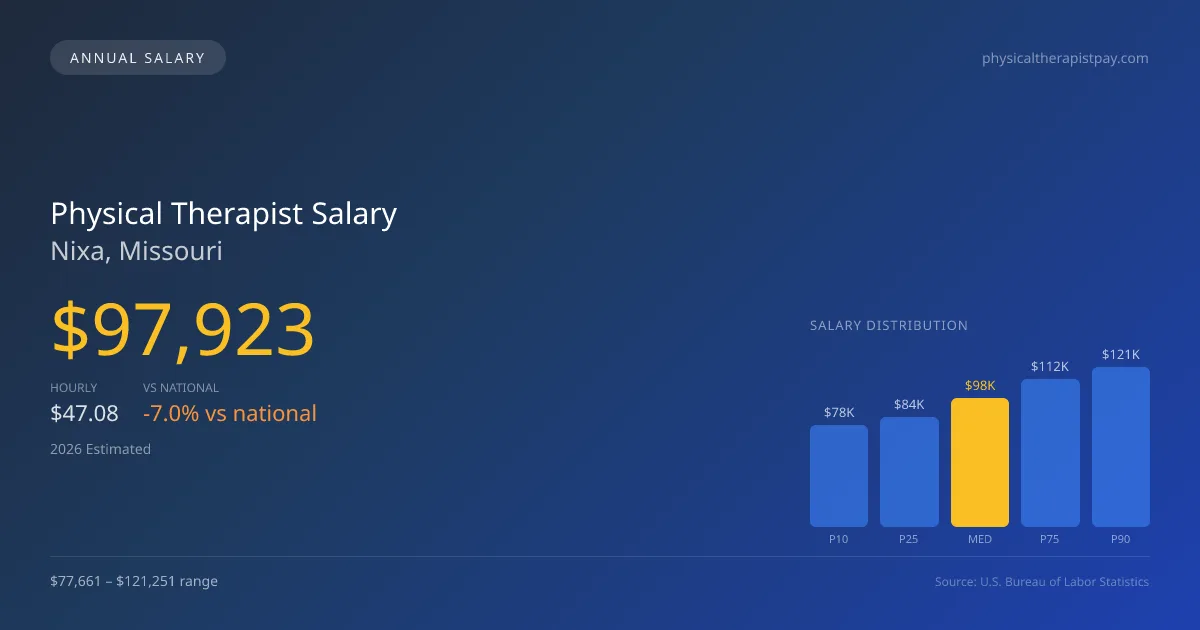
In Nixa, Missouri, physical therapists can expect to earn an estimated median annual salary of $97,923 in 2026, which reflects a decline of approximately 7.00% compared to the national median of $105,288. The salary range for this role locally spans from $77,661 at the 10th percentile to $121,251 at the 90th percentile. These projections are based on 2025 BLS data, adjusted for regional cost variations. The outpatient sector typically offers competitive pay scales, often below those of hospital or skilled nursing facility settings, which may provide enhanced benefits and stability. With a small market of only six employed physical therapists in the area, those entering the profession in Nixa can find opportunities for growth within the community.
About the Nixa Market
Salary estimated from Missouri average ($88,000) adjusted for local cost of living.
Salary Breakdown
| Percentile | Annual | Hourly |
|---|---|---|
| Entry Level (P10) | $77,661 | $37.34 |
| Lower Range (P25) | $83,536 | $40.16 |
| Median (P50)(typical) | $97,923 | $47.08 |
| Upper Range (P75) | $112,482 | $54.08 |
| Top Earners (P90) | $121,251 | $58.29 |
Median Salary Position
7% below the national average
2026 Salary Percentile Distribution in Nixa
In Nixa, MO, the physical therapist salary spread from the 10th to 90th percentile is $43,590 (2026 est.). At $97,923, the local median is 7% below the national median of $105,288.
Salary Calculator
At 40 hours/week in Nixa: You'd be in the lower-middle range
How Nixa Physical Therapist Pay Compares
Nixa median: $97,923/year (2026)
| Compared To | Median Salary | Nixa Pays |
|---|---|---|
| Missouri Average | $102,216 | -4.20% less |
| National Average | $105,288 | -7.00% less |
Physical Therapists in Nixa, MO earn a median of $97,923 per year (2026 est.), which is 7.00% lower than the national median of $105,288 and 4.20% below the Missouri state average of $102,216.
Cost-of-Living Adjusted Salary
Nixa has a cost of living 10.40% below the national average, meaning your salary goes further here.
Adjusted salary = nominal × (100 / CoL index). CoL index: 100 = national average.
Nixa, MO has a cost-of-living index of 89.6 (below the national average of 100). A physical therapist earning $97,923 nominally has purchasing power equivalent to $109,289 in an average-cost city — an effective 11.61% boost.
Compare Purchasing Power
Select a city to see how your salary compares after cost of living
Select a city above to compare purchasing power
2019 BLS Actual
$83,184
2025 BLS Actual
$95,572
2026 Current Est.
$97,923
2019–2027 Growth
+20.6%
Salary Trajectory for Physical Therapists in Nixa (2019–2027)
2019–2025: actual BLS OEWS data for this metro area. 2026+: CAGR 2.46% projection.
| Year | Annual Salary | Status |
|---|---|---|
| 2019 | $83,184 | Actual |
| 2020 | $84,644 | Actual |
| 2021 | $88,931 | Actual |
| 2022 | $90,885 | Actual |
| 2023 | $92,735 | Actual |
| 2024 | $75,561 | Actual |
| 2025 | $95,572 | Actual |
| 2026(current) | $97,923 | Estimated |
| 2027 | $100,332 | Projected |
Based on 7 years of BLS OEWS data for the Nixa metropolitan area, the median physical therapist salary grew 14.9% from $83,184 (2019) to $95,572 (2025). At a 2.46% compound annual growth rate, salaries are projected to reach $100,332 by 2027 — a total increase of $17,148 (20.61%) from 2019.
Note: Historical values (2019–2025) are actual BLS OEWS figures for the Nixa metropolitan area, sourced from annual Occupational Employment and Wage Statistics surveys. 2026–2026 figures are current estimates, and 2027 values are projections, calculated using a 2.46% CAGR derived from 7-year BLS historical data. Actual salaries may vary based on employer, experience, certifications, and local market conditions.
Salary by Experience Level
| Experience | Estimated Salary Range |
|---|---|
| 0-2 years (New Graduate) | $77,661 – $83,536 |
| 3-5 years (Mid Career) | $83,536 – $97,923 |
| 5+ years (Experienced) | $97,923 – $112,482 |
| 10+ years (Top Earner) | $112,482 – $121,251 |
PT salary ranges estimated from BLS percentile data. Individual physical therapist compensation varies by employer, certifications, and specialization.
Physical Therapist Job Market in Nixa
In terms of local job market dynamics, salaries can be influenced significantly by the prevailing cost of living index in Nixa, which stands at 89.6, indicating a lower cost compared to national averages. This lower cost of living can enhance overall purchasing power, allowing physical therapists to stretch their salaries further than in higher-cost markets. Outpatient orthopedic clinics, particularly large chains like Athletico, tend to top the salary scale, but often come with stringent productivity expectations linked to see more patients per day, which is a key factor in compensation. To maximize earnings, therapists might consider specializing by obtaining board certifications, such as OCS or SCS, which often come with stipends. Engaging in cash-pay models can also increase income compared to traditional insurance payment structures. Understanding these local nuances and leveraging specialization will be crucial for physical therapists seeking to elevate their pay in Nixa, MO.
More salary data for Nixa, MO:
Frequently Asked Questions
How much do physical therapists make in Nixa, MO in 2026?
Is Nixa, MO a good place to work as a physical therapist?
Can physical therapists make $100K in Nixa?
What is the cost-of-living adjusted physical therapist salary in Nixa?
How much does a physical therapist make per hour in Nixa?
Related Pages
Compare Salaries
Career Resources
Nearby Cities in Missouri
Written by Alex Morgan, DPT
Career Analyst
Alex Morgan has over 10 years of experience in physical therapy. They specialize in orthopedic rehabilitation. Alex works in a private practice setting.
Methodology & Data Source
Salary figures on this page are 2026 projections based on the Bureau of Labor Statistics Occupational Employment and Wage Statistics (OEWS) survey, May 2026 release. The BLS reported a median annual salary of $95,572 for physical therapistsin the Nixa metropolitan area. A 2.46% compound annual growth rate (CAGR), calculated from 6-year national BLS wage trends, was applied to project current 2026 compensation. Percentile ranges (P10–P90) represent the full salary distribution across experience levels and practice settings in this market.
Data Sources & Methodology
Salary data for Nixa is estimated from official BLS state-level occupational wage data (2025), adjusted for regional cost-of-living differences using BEA RPP (Regional Price Parities).
2026 figures are projected from 2025 BLS data using a compound annual growth rate (CAGR) of 2.46%, derived from historical BLS wage trends for physical therapists (SOC 29-1123).
Compiled and verified by Alex Morgan, DPT, a licensed physical therapist with 10+ years of clinical experience. · View source data at BLS.gov