Physical Therapist Salary in O'Fallon, MO: $102,129 (2026)
Quick Answer:A full-time physical therapist in O'Fallon, MO earns a median $102,129/year (≈ $49.10/hour) in nominal terms for 2026 — projected from BLS OEWS 2025 (SOC 29-1123). Once you factor in O'Fallon's price level (10% below national, BEA RPP 89.6), that paycheck buys what $113,983 would nationally. Nominal pay sits 0.1% below the Missouri state average.
Based on BLS state-level estimates · View source
In 2026, physical therapists in O'Fallon, Missouri, are projected to earn a median annual salary of $102,129, which is slightly below the national average of $105,288. Local pay varies significantly, with salaries ranging from $74,516 at the lower end to as much as $138,731 for the top earners. These figures reflect estimates based on 2025 BLS data and account for regional cost adjustments, positioning O'Fallon in a competitive, yet affordable market. The trend towards cash-pay models in outpatient orthopedic clinics has influenced higher salaries, particularly for specialists, potentially widening the disparity between general practice and specialty care within the community.
About the O'Fallon Market
Salary estimated from Missouri average ($88,000) adjusted for local cost of living.
Salary Breakdown
| Percentile | Annual | Hourly |
|---|---|---|
| Entry Level (P10) | $74,516 | $35.82 |
| Lower Range (P25) | $83,254 | $40.02 |
| Median (P50)(typical) | $102,129 | $49.10 |
| Upper Range (P75) | $119,941 | $57.66 |
| Top Earners (P90) | $138,731 | $66.70 |
Median Salary Position
3% below the national average
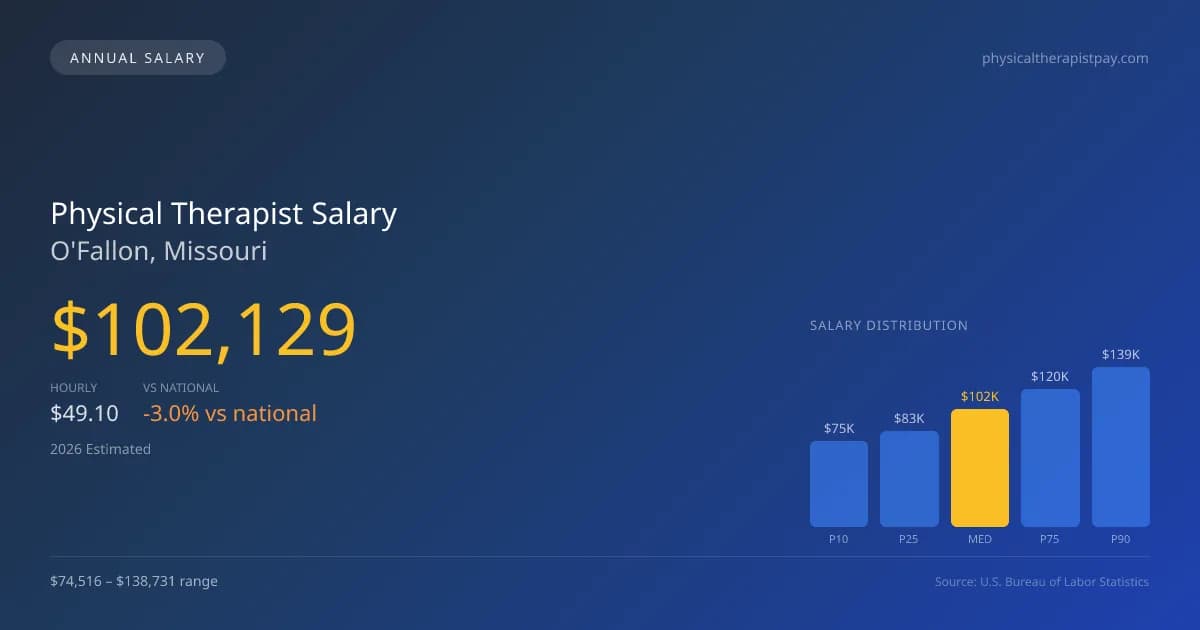
2026 Salary Percentile Distribution in O'Fallon
In O'Fallon, MO, the physical therapist salary spread from the 10th to 90th percentile is $64,215 (2026 est.). At $102,129, the local median is 3% below the national median of $105,288.
Salary Calculator
At 40 hours/week in O'Fallon: You'd be in the lower-middle range
How O'Fallon Physical Therapist Pay Compares
O'Fallon median: $102,129/year (2026)
| Compared To | Median Salary | O'Fallon Pays |
|---|---|---|
| Missouri Average | $102,231 | -0.10% less |
| National Average | $105,288 | -3.00% less |
Physical Therapists in O'Fallon, MO earn a median of $102,129 per year (2026 est.), which is 3.00% lower than the national median of $105,288 and 0.10% below the Missouri state average of $102,231.
Cost-of-Living Adjusted Salary
O'Fallon has a cost of living 10.40% below the national average, meaning your salary goes further here.
Adjusted salary = nominal × (100 / CoL index). CoL index: 100 = national average.
O'Fallon, MO has a cost-of-living index of 89.6 (below the national average of 100). A physical therapist earning $102,129 nominally has purchasing power equivalent to $113,983 in an average-cost city — an effective 11.61% boost.
Compare Purchasing Power
Select a city to see how your salary compares after cost of living
Select a city above to compare purchasing power
2019 BLS Actual
$86,757
2025 BLS Actual
$99,677
2026 Current Est.
$102,129
2019–2027 Growth
+20.6%
Salary Trajectory for Physical Therapists in O'Fallon (2019–2027)
2019–2025: actual BLS OEWS data for this metro area. 2026+: CAGR 2.46% projection.
| Year | Annual Salary | Status |
|---|---|---|
| 2019 | $86,757 | Actual |
| 2020 | $88,280 | Actual |
| 2021 | $92,751 | Actual |
| 2022 | $94,788 | Actual |
| 2023 | $96,719 | Actual |
| 2024 | $78,806 | Actual |
| 2025 | $99,677 | Actual |
| 2026(current) | $102,129 | Estimated |
| 2027 | $104,641 | Projected |
Based on 7 years of BLS OEWS data for the O'Fallon metropolitan area, the median physical therapist salary grew 14.9% from $86,757 (2019) to $99,677 (2025). At a 2.46% compound annual growth rate, salaries are projected to reach $104,641 by 2027 — a total increase of $17,884 (20.61%) from 2019.
Note: Historical values (2019–2025) are actual BLS OEWS figures for the O'Fallon metropolitan area, sourced from annual Occupational Employment and Wage Statistics surveys. 2026–2026 figures are current estimates, and 2027 values are projections, calculated using a 2.46% CAGR derived from 7-year BLS historical data. Actual salaries may vary based on employer, experience, certifications, and local market conditions.
Salary by Experience Level
| Experience | Estimated Salary Range |
|---|---|
| 0-2 years (New Graduate) | $74,516 – $83,254 |
| 3-5 years (Mid Career) | $83,254 – $102,129 |
| 5+ years (Experienced) | $102,129 – $119,941 |
| 10+ years (Top Earner) | $119,941 – $138,731 |
PT salary ranges estimated from BLS percentile data. Individual physical therapist compensation varies by employer, certifications, and specialization.
Physical Therapist Job Market in O'Fallon
The job market for physical therapists in O'Fallon includes around 22 professionals, which indicates a local field with modest competition. With a cost-of-living index at 89.6, residents benefit from a living environment cheaper than the national average, enhancing the purchasing power of their earnings. Among local employers, outpatient orthopedic clinics, including chains like Athletico, tend to pay less than the hospital inpatient rehab facilities, which often offer better compensation packages and additional incentives for productivity. Factors such as board certifications like the OCS and SCS can significantly boost earnings, as can clinic ownership or a move towards cash-pay practices, where therapists may earn more per visit. To maximize physical therapist pay in O'Fallon, professionals should consider pursuing specialization certifications and seek employment opportunities with facilities that prioritize high-quality patient outcomes and offer productivity incentives.
More salary data for O'Fallon, MO:
Frequently Asked Questions
How much do physical therapists make in O'Fallon, MO in 2026?
Is O'Fallon, MO a good place to work as a physical therapist?
Can physical therapists make $100K in O'Fallon?
What is the cost-of-living adjusted physical therapist salary in O'Fallon?
How much does a physical therapist make per hour in O'Fallon?
Related Pages
Compare Salaries
Career Resources
Nearby Cities in Missouri
Written by Alex Morgan, DPT
Career Analyst
Alex Morgan has over 10 years of experience in physical therapy. They specialize in orthopedic rehabilitation. Alex works in a private practice setting.
Methodology & Data Source
Salary figures on this page are 2026 projections based on the Bureau of Labor Statistics Occupational Employment and Wage Statistics (OEWS) survey, May 2026 release. The BLS reported a median annual salary of $99,677 for physical therapistsin the O'Fallon metropolitan area. A 2.46% compound annual growth rate (CAGR), calculated from 6-year national BLS wage trends, was applied to project current 2026 compensation. Percentile ranges (P10–P90) represent the full salary distribution across experience levels and practice settings in this market.
Data Sources & Methodology
Salary data for O'Fallon is estimated from official BLS state-level occupational wage data (2025), adjusted for regional cost-of-living differences using BEA RPP (Regional Price Parities).
2026 figures are projected from 2025 BLS data using a compound annual growth rate (CAGR) of 2.46%, derived from historical BLS wage trends for physical therapists (SOC 29-1123).
Compiled and verified by Alex Morgan, DPT, a licensed physical therapist with 10+ years of clinical experience. · View source data at BLS.gov