Physical Therapist Salary in Raymore, MO: $94,596 (2026)
Quick Answer:A full-time physical therapist in Raymore, MO earns a median $94,596/year (≈ $45.48/hour) in nominal terms for 2026 — projected from BLS OEWS 2025 (SOC 29-1123). Once you factor in Raymore's price level (10% below national, BEA RPP 89.6), that paycheck buys what $105,576 would nationally. Nominal pay sits 7.4% below the Missouri state average.
Based on BLS state-level estimates · View source
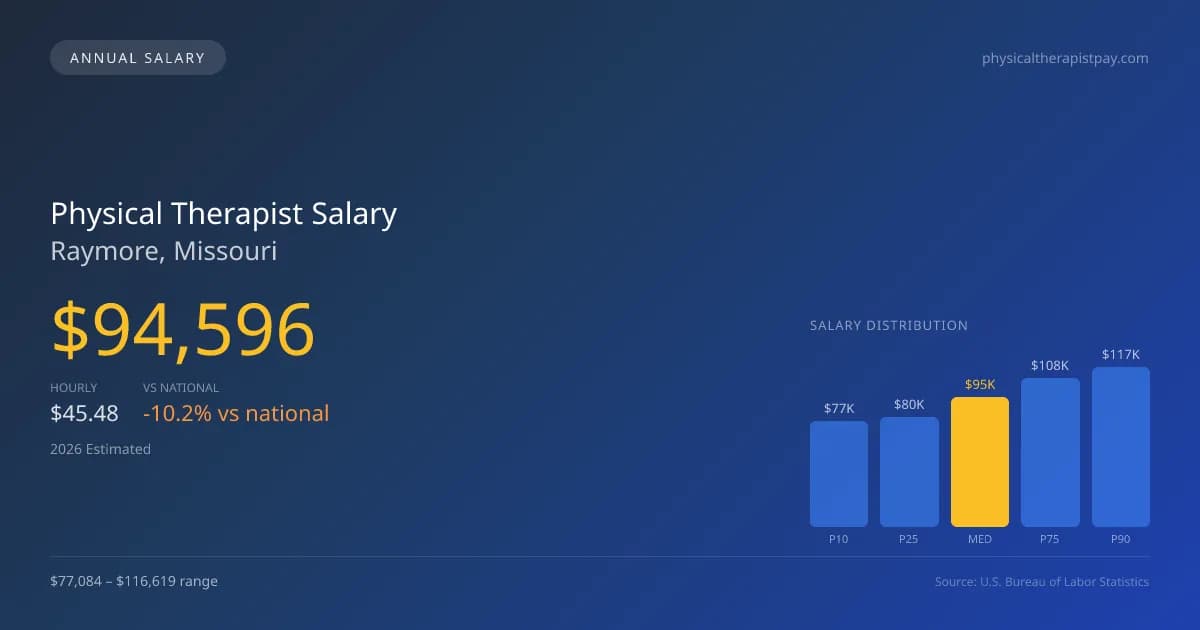
In Raymore, Missouri, the projected median annual salary for physical therapists in 2026 is $94,596, reflecting a competitive market in the realm of physical therapist pay. With a salary range spanning from $77,084 at the 10th percentile to $116,619 at the 90th percentile, therapists in the area can achieve substantial earnings, especially those who excel in cash-pay practices within sports and orthopedic specializations. These projections, derived from 2025 BLS data adjusted for regional cost factors, indicate a local compensation scenario that lags approximately 10.16% behind the national median of $105,288, signaling a distinct opportunity for growth and development for emerging talent and seasoned professionals alike in the Raymore job market.
About the Raymore Market
Salary estimated from Missouri average ($88,000) adjusted for local cost of living.
Salary Breakdown
| Percentile | Annual | Hourly |
|---|---|---|
| Entry Level (P10) | $77,084 | $37.06 |
| Lower Range (P25) | $80,360 | $38.64 |
| Median (P50)(typical) | $94,596 | $45.48 |
| Upper Range (P75) | $108,343 | $52.09 |
| Top Earners (P90) | $116,619 | $56.07 |
Median Salary Position
10.16% below the national average
2026 Salary Percentile Distribution in Raymore
In Raymore, MO, the physical therapist salary spread from the 10th to 90th percentile is $39,535 (2026 est.). At $94,596, the local median is 10.16% below the national median of $105,288.
Salary Calculator
At 40 hours/week in Raymore: You'd be in the lower-middle range
How Raymore Physical Therapist Pay Compares
Raymore median: $94,596/year (2026)
| Compared To | Median Salary | Raymore Pays |
|---|---|---|
| Missouri Average | $102,156 | -7.40% less |
| National Average | $105,288 | -10.16% less |
Physical Therapists in Raymore, MO earn a median of $94,596 per year (2026 est.), which is 10.16% lower than the national median of $105,288 and 7.40% below the Missouri state average of $102,156.
Cost-of-Living Adjusted Salary
Raymore has a cost of living 10.40% below the national average, meaning your salary goes further here.
Adjusted salary = nominal × (100 / CoL index). CoL index: 100 = national average.
Raymore, MO has a cost-of-living index of 89.6 (below the national average of 100). A physical therapist earning $94,596 nominally has purchasing power equivalent to $105,576 in an average-cost city — an effective 11.61% boost.
Compare Purchasing Power
Select a city to see how your salary compares after cost of living
Select a city above to compare purchasing power
2019 BLS Actual
$80,358
2025 BLS Actual
$92,325
2026 Current Est.
$94,596
2019–2027 Growth
+20.6%
Salary Trajectory for Physical Therapists in Raymore (2019–2027)
2019–2025: actual BLS OEWS data for this metro area. 2026+: CAGR 2.46% projection.
| Year | Annual Salary | Status |
|---|---|---|
| 2019 | $80,358 | Actual |
| 2020 | $81,768 | Actual |
| 2021 | $85,910 | Actual |
| 2022 | $87,797 | Actual |
| 2023 | $89,585 | Actual |
| 2024 | $72,994 | Actual |
| 2025 | $92,325 | Actual |
| 2026(current) | $94,596 | Estimated |
| 2027 | $96,923 | Projected |
Based on 7 years of BLS OEWS data for the Raymore metropolitan area, the median physical therapist salary grew 14.9% from $80,358 (2019) to $92,325 (2025). At a 2.46% compound annual growth rate, salaries are projected to reach $96,923 by 2027 — a total increase of $16,565 (20.61%) from 2019.
Note: Historical values (2019–2025) are actual BLS OEWS figures for the Raymore metropolitan area, sourced from annual Occupational Employment and Wage Statistics surveys. 2026–2026 figures are current estimates, and 2027 values are projections, calculated using a 2.46% CAGR derived from 7-year BLS historical data. Actual salaries may vary based on employer, experience, certifications, and local market conditions.
Salary by Experience Level
| Experience | Estimated Salary Range |
|---|---|
| 0-2 years (New Graduate) | $77,084 – $80,360 |
| 3-5 years (Mid Career) | $80,360 – $94,596 |
| 5+ years (Experienced) | $94,596 – $108,343 |
| 10+ years (Top Earner) | $108,343 – $116,619 |
PT salary ranges estimated from BLS percentile data. Individual physical therapist compensation varies by employer, certifications, and specialization.
Physical Therapist Job Market in Raymore
Examining the local job market further reveals the employment of only six physical therapists in Raymore, contributing to a competitive yet intimate community of practitioners. The cost of living index sits at 89.6, suggesting that take-home pay can stretch further than in many urban areas, enhancing purchasing power. Prospective employers include outpatient orthopedic clinics and hospital systems, which typically offer higher compensation compared to skilled nursing facilities and home health agencies. The pay gap here is influenced by multiple factors, including productivity expectations, potential stipends for board certifications like OCS or SCS, and the dynamics between cash-pay and insurance-based practices. For those looking to maximize their physical therapist salary in Raymore, leveraging specialty certifications and exploring roles in cash-pay practices may provide significant financial rewards in this evolving healthcare landscape.
More salary data for Raymore, MO:
Frequently Asked Questions
How much do physical therapists make in Raymore, MO in 2026?
Is Raymore, MO a good place to work as a physical therapist?
Can physical therapists make $100K in Raymore?
What is the cost-of-living adjusted physical therapist salary in Raymore?
How much does a physical therapist make per hour in Raymore?
Related Pages
Compare Salaries
Career Resources
Nearby Cities in Missouri
Written by Alex Morgan, DPT
Career Analyst
Alex Morgan has over 10 years of experience in physical therapy. They specialize in orthopedic rehabilitation. Alex works in a private practice setting.
Methodology & Data Source
Salary figures on this page are 2026 projections based on the Bureau of Labor Statistics Occupational Employment and Wage Statistics (OEWS) survey, May 2026 release. The BLS reported a median annual salary of $92,325 for physical therapistsin the Raymore metropolitan area. A 2.46% compound annual growth rate (CAGR), calculated from 6-year national BLS wage trends, was applied to project current 2026 compensation. Percentile ranges (P10–P90) represent the full salary distribution across experience levels and practice settings in this market.
Data Sources & Methodology
Salary data for Raymore is estimated from official BLS state-level occupational wage data (2025), adjusted for regional cost-of-living differences using BEA RPP (Regional Price Parities).
2026 figures are projected from 2025 BLS data using a compound annual growth rate (CAGR) of 2.46%, derived from historical BLS wage trends for physical therapists (SOC 29-1123).
Compiled and verified by Alex Morgan, DPT, a licensed physical therapist with 10+ years of clinical experience. · View source data at BLS.gov