Physical Therapist Salary in Sedalia, MO: $98,107 (2026)
Quick Answer:A full-time physical therapist in Sedalia, MO earns a median $98,107/year (≈ $47.16/hour) in nominal terms for 2026 — projected from BLS OEWS 2025 (SOC 29-1123). Once you factor in Sedalia's price level (10% below national, BEA RPP 89.6), that paycheck buys what $109,494 would nationally. Nominal pay sits 4.0% below the Missouri state average.
Based on BLS state-level estimates · View source
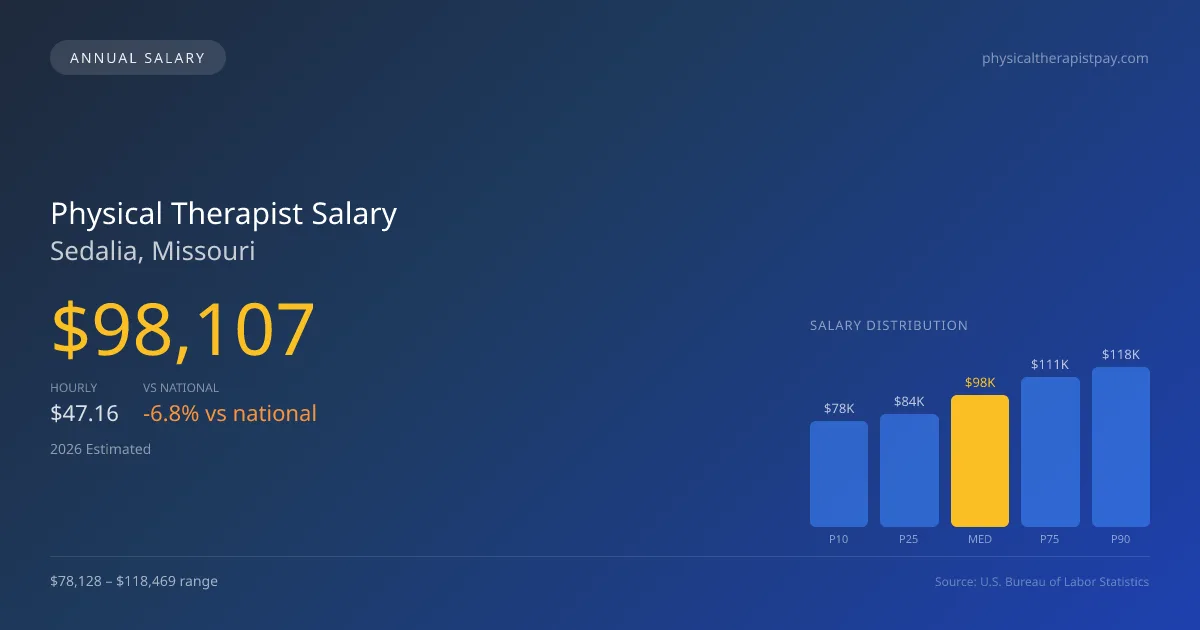
In 2026, professionals in Sedalia, Missouri, can expect an annual salary of approximately $98,107 as a physical therapist, which is about 6.82% lower than the national median of $105,288. Salary ranges for these positions vary significantly, from $78,128 at the 10th percentile to $118,469 at the 90th percentile. These figures, derived from state-level data and adjusted for regional price parities, reflect the local employment landscape, which often prioritizes outpatient orthopedic facilities over hospital settings. The choice of practice setting plays a significant role in determining compensation, as outpatient chains like ATI and Athletico may provide lower base salaries compared to hospital systems but can offer performance bonuses tied to productivity metrics.
About the Sedalia Market
Salary estimated from Missouri average ($88,000) adjusted for local cost of living.
Salary Breakdown
| Percentile | Annual | Hourly |
|---|---|---|
| Entry Level (P10) | $78,128 | $37.56 |
| Lower Range (P25) | $83,926 | $40.35 |
| Median (P50)(typical) | $98,107 | $47.16 |
| Upper Range (P75) | $110,831 | $53.28 |
| Top Earners (P90) | $118,469 | $56.96 |
Median Salary Position
6.82% below the national average
2026 Salary Percentile Distribution in Sedalia
In Sedalia, MO, the physical therapist salary spread from the 10th to 90th percentile is $40,341 (2026 est.). At $98,107, the local median is 6.82% below the national median of $105,288.
Salary Calculator
At 40 hours/week in Sedalia: You'd be above the median
How Sedalia Physical Therapist Pay Compares
Sedalia median: $98,107/year (2026)
| Compared To | Median Salary | Sedalia Pays |
|---|---|---|
| Missouri Average | $102,195 | -4.00% less |
| National Average | $105,288 | -6.82% less |
Physical Therapists in Sedalia, MO earn a median of $98,107 per year (2026 est.), which is 6.82% lower than the national median of $105,288 and 4.00% below the Missouri state average of $102,195.
Cost-of-Living Adjusted Salary
Sedalia has a cost of living 10.40% below the national average, meaning your salary goes further here.
Adjusted salary = nominal × (100 / CoL index). CoL index: 100 = national average.
Sedalia, MO has a cost-of-living index of 89.6 (below the national average of 100). A physical therapist earning $98,107 nominally has purchasing power equivalent to $109,494 in an average-cost city — an effective 11.61% boost.
Compare Purchasing Power
Select a city to see how your salary compares after cost of living
Select a city above to compare purchasing power
2019 BLS Actual
$83,340
2025 BLS Actual
$95,752
2026 Current Est.
$98,107
2019–2027 Growth
+20.6%
Salary Trajectory for Physical Therapists in Sedalia (2019–2027)
2019–2025: actual BLS OEWS data for this metro area. 2026+: CAGR 2.46% projection.
| Year | Annual Salary | Status |
|---|---|---|
| 2019 | $83,340 | Actual |
| 2020 | $84,803 | Actual |
| 2021 | $89,099 | Actual |
| 2022 | $91,056 | Actual |
| 2023 | $92,910 | Actual |
| 2024 | $75,703 | Actual |
| 2025 | $95,752 | Actual |
| 2026(current) | $98,107 | Estimated |
| 2027 | $100,521 | Projected |
Based on 7 years of BLS OEWS data for the Sedalia metropolitan area, the median physical therapist salary grew 14.9% from $83,340 (2019) to $95,752 (2025). At a 2.46% compound annual growth rate, salaries are projected to reach $100,521 by 2027 — a total increase of $17,181 (20.62%) from 2019.
Note: Historical values (2019–2025) are actual BLS OEWS figures for the Sedalia metropolitan area, sourced from annual Occupational Employment and Wage Statistics surveys. 2026–2026 figures are current estimates, and 2027 values are projections, calculated using a 2.46% CAGR derived from 7-year BLS historical data. Actual salaries may vary based on employer, experience, certifications, and local market conditions.
Salary by Experience Level
| Experience | Estimated Salary Range |
|---|---|
| 0-2 years (New Graduate) | $78,128 – $83,926 |
| 3-5 years (Mid Career) | $83,926 – $98,107 |
| 5+ years (Experienced) | $98,107 – $110,831 |
| 10+ years (Top Earner) | $110,831 – $118,469 |
PT salary ranges estimated from BLS percentile data. Individual physical therapist compensation varies by employer, certifications, and specialization.
Physical Therapist Job Market in Sedalia
Analyzing the job market in Sedalia reveals that only six physical therapists are currently employed in the area, indicating a relatively tight labor pool. The local cost-of-living index sits at 89.6, below the national average, which can enhance take-home purchasing power, making the already competitive physical therapist pay in Sedalia MO more appealing. Among employers, outpatient clinics may struggle to match the compensation of skilled nursing facilities or hospital-based rehabilitation centers, where productivity expectations and board certifications can influence higher wages. Factors contributing to variances in salaries include the volume of patient interactions, specialty certifications like OCS and SCS that may bring stipends, and the financial model of the clinic—cash-pay setups can yield higher earnings compared to insurance-based practices. For physical therapists looking to maximize their salaries in this market, focusing on specialty certifications, considering travel PT opportunities, and seeking employment with higher-paying employers like hospitals can be advantageous strategies.
More salary data for Sedalia, MO:
Frequently Asked Questions
How much do physical therapists make in Sedalia, MO in 2026?
Is Sedalia, MO a good place to work as a physical therapist?
Can physical therapists make $100K in Sedalia?
What is the cost-of-living adjusted physical therapist salary in Sedalia?
How much does a physical therapist make per hour in Sedalia?
Related Pages
Compare Salaries
Career Resources
Nearby Cities in Missouri
Written by Alex Morgan, DPT
Career Analyst
Alex Morgan has over 10 years of experience in physical therapy. They specialize in orthopedic rehabilitation. Alex works in a private practice setting.
Methodology & Data Source
Salary figures on this page are 2026 projections based on the Bureau of Labor Statistics Occupational Employment and Wage Statistics (OEWS) survey, May 2026 release. The BLS reported a median annual salary of $95,752 for physical therapistsin the Sedalia metropolitan area. A 2.46% compound annual growth rate (CAGR), calculated from 6-year national BLS wage trends, was applied to project current 2026 compensation. Percentile ranges (P10–P90) represent the full salary distribution across experience levels and practice settings in this market.
Data Sources & Methodology
Salary data for Sedalia is estimated from official BLS state-level occupational wage data (2025), adjusted for regional cost-of-living differences using BEA RPP (Regional Price Parities).
2026 figures are projected from 2025 BLS data using a compound annual growth rate (CAGR) of 2.46%, derived from historical BLS wage trends for physical therapists (SOC 29-1123).
Compiled and verified by Alex Morgan, DPT, a licensed physical therapist with 10+ years of clinical experience. · View source data at BLS.gov